Data
87,996 items of data are available, covering 83,313 participants.
Defined-instances run from 2 to 3, labelled using Instancing
2.
Units of measurement are mm3.
| Maximum | 1698.7 |
| Decile 9 | 755.582 |
| Decile 8 | 720.027 |
| Decile 7 | 694.87 |
| Decile 6 | 673.899 |
| Median | 653.976 |
| Decile 4 | 634.159 |
| Decile 3 | 613.084 |
| Decile 2 | 588.004 |
| Decile 1 | 552.992 |
| Minimum | 318.343 |
|

|
- Mean = 654.541
- Std.dev = 79.3332
- 3 items below graph minimum of 350.401
- 31 items above graph maximum of 958.172
|
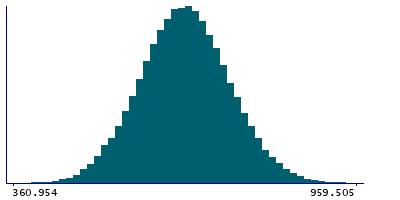
2 Instances
Instance 2 : Imaging visit (2014+)
83,241 participants, 83,241 items
| Maximum | 1698.7 |
| Decile 9 | 755.187 |
| Decile 8 | 719.553 |
| Decile 7 | 694.389 |
| Decile 6 | 673.377 |
| Median | 653.352 |
| Decile 4 | 633.57 |
| Decile 3 | 612.426 |
| Decile 2 | 587.371 |
| Decile 1 | 552.412 |
| Minimum | 318.343 |
|
|
- Mean = 653.973
- Std.dev = 79.3367
- 3 items below graph minimum of 349.637
- 29 items above graph maximum of 957.961
|
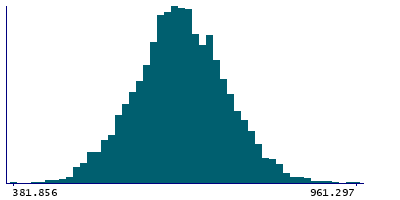
Instance 3 : First repeat imaging visit (2019+)
4,755 participants, 4,755 items
| Maximum | 1550.3 |
| Decile 9 | 763.179 |
| Decile 8 | 727.87 |
| Decile 7 | 704.098 |
| Decile 6 | 681.6 |
| Median | 663.207 |
| Decile 4 | 644.945 |
| Decile 3 | 625.589 |
| Decile 2 | 600.922 |
| Decile 1 | 565.165 |
| Minimum | 381.856 |
|
|
- Mean = 664.496
- Std.dev = 78.6083
- 2 items above graph maximum of 961.193
|
Notes
Volume of MDm in the right hemisphere generated by subcortical volumetric sub-segmentation of the Thalamic Nuclei
0 Related Data-Fields
There are no related data-fields
0 Resources
There are no matching Resources
