Data
87,996 items of data are available, covering 83,313 participants.
Defined-instances run from 2 to 3, labelled using Instancing
2.
Units of measurement are mm3.
| Maximum | 509.246 |
| Decile 9 | 268.355 |
| Decile 8 | 252.921 |
| Decile 7 | 242.48 |
| Decile 6 | 234.146 |
| Median | 226.593 |
| Decile 4 | 219.415 |
| Decile 3 | 212.009 |
| Decile 2 | 203.963 |
| Decile 1 | 193.552 |
| Minimum | 126.804 |
|
|
- Mean = 229.208
- Std.dev = 29.7416
- 117 items above graph maximum of 343.157
|
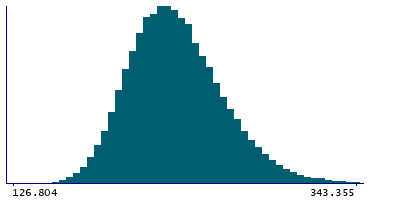
2 Instances
Instance 2 : Imaging visit (2014+)
83,241 participants, 83,241 items
| Maximum | 490.958 |
| Decile 9 | 268.349 |
| Decile 8 | 252.868 |
| Decile 7 | 242.434 |
| Decile 6 | 234.116 |
| Median | 226.557 |
| Decile 4 | 219.389 |
| Decile 3 | 211.984 |
| Decile 2 | 203.896 |
| Decile 1 | 193.461 |
| Minimum | 126.804 |
|

|
- Mean = 229.156
- Std.dev = 29.7243
- 111 items above graph maximum of 343.237
|
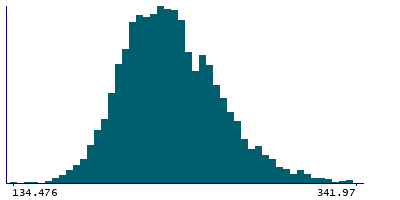
Instance 3 : First repeat imaging visit (2019+)
4,755 participants, 4,755 items
| Maximum | 509.246 |
| Decile 9 | 268.507 |
| Decile 8 | 254.205 |
| Decile 7 | 243.628 |
| Decile 6 | 234.646 |
| Median | 227.359 |
| Decile 4 | 220.117 |
| Decile 3 | 212.547 |
| Decile 2 | 204.972 |
| Decile 1 | 195.176 |
| Minimum | 134.476 |
|
|
- Mean = 230.123
- Std.dev = 30.0286
- 6 items above graph maximum of 341.837
|
Notes
Volume of CM in the right hemisphere generated by subcortical volumetric sub-segmentation of the Thalamic Nuclei
0 Related Data-Fields
There are no related data-fields
0 Resources
There are no matching Resources
