Data
87,996 items of data are available, covering 83,313 participants.
Defined-instances run from 2 to 3, labelled using Instancing
2.
Units of measurement are mm3.
| Maximum | 3158.17 |
| Decile 9 | 1105.27 |
| Decile 8 | 1052.53 |
| Decile 7 | 1016.16 |
| Decile 6 | 985.499 |
| Median | 957.518 |
| Decile 4 | 930.328 |
| Decile 3 | 901.983 |
| Decile 2 | 870.216 |
| Decile 1 | 828.093 |
| Minimum | 452.846 |
|

|
- Mean = 963.003
- Std.dev = 109.765
- 5 items below graph minimum of 550.915
- 54 items above graph maximum of 1382.45
|
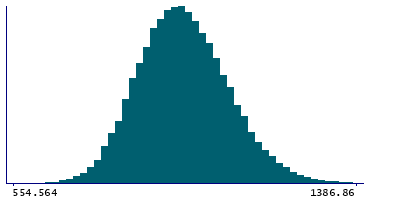
2 Instances
Instance 2 : Imaging visit (2014+)
83,241 participants, 83,241 items
| Maximum | 3158.17 |
| Decile 9 | 1104.62 |
| Decile 8 | 1052.01 |
| Decile 7 | 1015.61 |
| Decile 6 | 984.767 |
| Median | 956.942 |
| Decile 4 | 929.71 |
| Decile 3 | 901.407 |
| Decile 2 | 869.513 |
| Decile 1 | 827.487 |
| Minimum | 452.846 |
|
|
- Mean = 962.368
- Std.dev = 109.711
- 5 items below graph minimum of 550.355
- 49 items above graph maximum of 1381.75
|
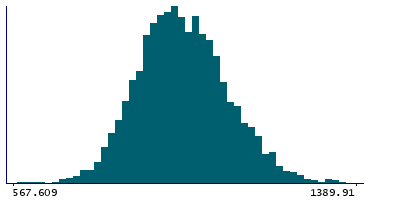
Instance 3 : First repeat imaging visit (2019+)
4,755 participants, 4,755 items
| Maximum | 2166.51 |
| Decile 9 | 1115.81 |
| Decile 8 | 1061.71 |
| Decile 7 | 1026.97 |
| Decile 6 | 997.489 |
| Median | 967.679 |
| Decile 4 | 941.01 |
| Decile 3 | 913.447 |
| Decile 2 | 883.778 |
| Decile 1 | 841.803 |
| Minimum | 560.587 |
|
|
- Mean = 974.125
- Std.dev = 110.118
- 1 item below graph minimum of 567.799
- 5 items above graph maximum of 1389.81
|
Notes
Volume of PuM in the right hemisphere generated by subcortical volumetric sub-segmentation of the Thalamic Nuclei
0 Related Data-Fields
There are no related data-fields
0 Resources
There are no matching Resources
