Data
87,996 items of data are available, covering 83,313 participants.
Defined-instances run from 2 to 3, labelled using Instancing
2.
Units of measurement are mm3.
| Maximum | 429.237 |
| Decile 9 | 218.391 |
| Decile 8 | 204.339 |
| Decile 7 | 194.624 |
| Decile 6 | 186.666 |
| Median | 179.335 |
| Decile 4 | 172.248 |
| Decile 3 | 164.728 |
| Decile 2 | 156.07 |
| Decile 1 | 144.494 |
| Minimum | 24.1054 |
|

|
- Mean = 180.552
- Std.dev = 29.1162
- 35 items above graph maximum of 292.287
|
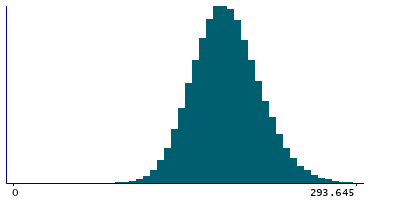
2 Instances
Instance 2 : Imaging visit (2014+)
83,241 participants, 83,241 items
| Maximum | 364.692 |
| Decile 9 | 218.223 |
| Decile 8 | 204.045 |
| Decile 7 | 194.353 |
| Decile 6 | 186.388 |
| Median | 179.046 |
| Decile 4 | 171.971 |
| Decile 3 | 164.445 |
| Decile 2 | 155.811 |
| Decile 1 | 144.256 |
| Minimum | 24.1054 |
|
|
- Mean = 180.28
- Std.dev = 29.1105
- 30 items above graph maximum of 292.19
|
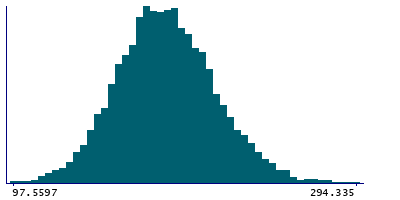
Instance 3 : First repeat imaging visit (2019+)
4,755 participants, 4,755 items
| Maximum | 429.237 |
| Decile 9 | 222.109 |
| Decile 8 | 208.313 |
| Decile 7 | 199.205 |
| Decile 6 | 191.272 |
| Median | 184.234 |
| Decile 4 | 177.106 |
| Decile 3 | 169.993 |
| Decile 2 | 161.492 |
| Decile 1 | 149.882 |
| Minimum | 97.5597 |
|
|
- Mean = 185.313
- Std.dev = 28.8041
- 4 items above graph maximum of 294.335
|
Notes
Volume of LGN in the right hemisphere generated by subcortical volumetric sub-segmentation of the Thalamic Nuclei
0 Related Data-Fields
There are no related data-fields
0 Resources
There are no matching Resources
