Data
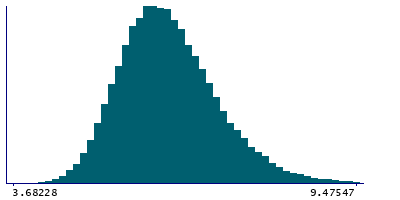
87,996 items of data are available, covering 83,313 participants.
Defined-instances run from 2 to 3, labelled using Instancing
2.
Units of measurement are mm3.
| Maximum | 22.6093 |
| Decile 9 | 7.41394 |
| Decile 8 | 6.96454 |
| Decile 7 | 6.67302 |
| Decile 6 | 6.4395 |
| Median | 6.23131 |
| Decile 4 | 6.02986 |
| Decile 3 | 5.82977 |
| Decile 2 | 5.60958 |
| Decile 1 | 5.31981 |
| Minimum | 3.45958 |
|

|
- Mean = 6.31393
- Std.dev = 0.846772
- 184 items above graph maximum of 9.50806
|
2 Instances
Instance 2 : Imaging visit (2014+)
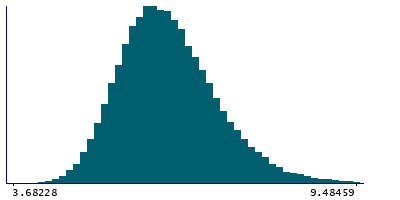
83,241 participants, 83,241 items
| Maximum | 22.6093 |
| Decile 9 | 7.41647 |
| Decile 8 | 6.96686 |
| Decile 7 | 6.67345 |
| Decile 6 | 6.44009 |
| Median | 6.23172 |
| Decile 4 | 6.02951 |
| Decile 3 | 5.82914 |
| Decile 2 | 5.60895 |
| Decile 1 | 5.31888 |
| Minimum | 3.45958 |
|

|
- Mean = 6.31411
- Std.dev = 0.846437
- 169 items above graph maximum of 9.51407
|
Instance 3 : First repeat imaging visit (2019+)
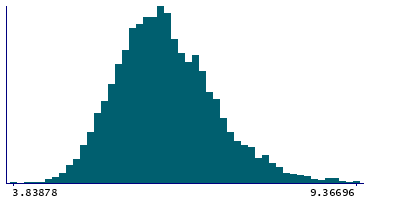
4,755 participants, 4,755 items
| Maximum | 18.0973 |
| Decile 9 | 7.35276 |
| Decile 8 | 6.93409 |
| Decile 7 | 6.66522 |
| Decile 6 | 6.41744 |
| Median | 6.22604 |
| Decile 4 | 6.03483 |
| Decile 3 | 5.84104 |
| Decile 2 | 5.62572 |
| Decile 1 | 5.34056 |
| Minimum | 3.83878 |
|

|
- Mean = 6.31071
- Std.dev = 0.852617
- 15 items above graph maximum of 9.36496
|
Notes
Volume of Pt in the left hemisphere generated by subcortical volumetric sub-segmentation of the Thalamic Nuclei
0 Related Data-Fields
There are no related data-fields
0 Resources
There are no matching Resources


