Data
87,996 items of data are available, covering 83,313 participants.
Defined-instances run from 2 to 3, labelled using Instancing
2.
Units of measurement are mm3.
| Maximum | 786.353 |
| Decile 9 | 291.057 |
| Decile 8 | 276.628 |
| Decile 7 | 266.708 |
| Decile 6 | 258.735 |
| Median | 251.734 |
| Decile 4 | 244.759 |
| Decile 3 | 237.655 |
| Decile 2 | 229.4 |
| Decile 1 | 218.615 |
| Minimum | 104.755 |
|
|
- Mean = 253.681
- Std.dev = 29.3644
- 17 items below graph minimum of 146.173
- 179 items above graph maximum of 363.5
|
2 Instances
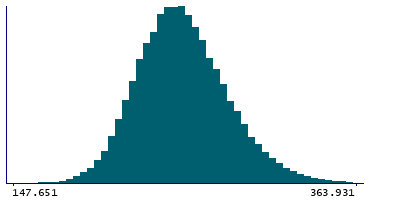
Instance 2 : Imaging visit (2014+)
83,241 participants, 83,241 items
| Maximum | 786.353 |
| Decile 9 | 290.954 |
| Decile 8 | 276.561 |
| Decile 7 | 266.645 |
| Decile 6 | 258.675 |
| Median | 251.68 |
| Decile 4 | 244.674 |
| Decile 3 | 237.495 |
| Decile 2 | 229.284 |
| Decile 1 | 218.528 |
| Minimum | 104.755 |
|

|
- Mean = 253.583
- Std.dev = 29.3425
- 16 items below graph minimum of 146.102
- 166 items above graph maximum of 363.38
|
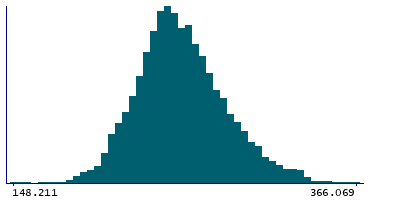
Instance 3 : First repeat imaging visit (2019+)
4,755 participants, 4,755 items
| Maximum | 566.454 |
| Decile 9 | 293.45 |
| Decile 8 | 277.936 |
| Decile 7 | 267.753 |
| Decile 6 | 259.862 |
| Median | 252.511 |
| Decile 4 | 246.143 |
| Decile 3 | 239.755 |
| Decile 2 | 232.167 |
| Decile 1 | 220.83 |
| Minimum | 127.067 |
|
|
- Mean = 255.395
- Std.dev = 29.6925
- 1 item below graph minimum of 148.211
- 11 items above graph maximum of 366.069
|
Notes
Volume of MDl in the left hemisphere generated by subcortical volumetric sub-segmentation of the Thalamic Nuclei
0 Related Data-Fields
There are no related data-fields
0 Resources
There are no matching Resources
