Data
87,996 items of data are available, covering 83,313 participants.
Defined-instances run from 2 to 3, labelled using Instancing
2.
Units of measurement are mm3.
| Maximum | 568.761 |
| Decile 9 | 274.568 |
| Decile 8 | 258.587 |
| Decile 7 | 247.749 |
| Decile 6 | 239.261 |
| Median | 231.484 |
| Decile 4 | 224.073 |
| Decile 3 | 216.507 |
| Decile 2 | 208.308 |
| Decile 1 | 197.345 |
| Minimum | 114.774 |
|
|
- Mean = 234.206
- Std.dev = 30.6783
- 1 item below graph minimum of 120.123
- 114 items above graph maximum of 351.79
|
2 Instances
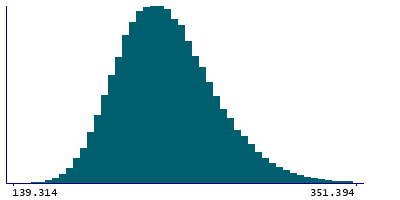
Instance 2 : Imaging visit (2014+)
83,241 participants, 83,241 items
| Maximum | 531.577 |
| Decile 9 | 274.602 |
| Decile 8 | 258.61 |
| Decile 7 | 247.753 |
| Decile 6 | 239.276 |
| Median | 231.48 |
| Decile 4 | 224.051 |
| Decile 3 | 216.472 |
| Decile 2 | 208.261 |
| Decile 1 | 197.277 |
| Minimum | 114.774 |
|

|
- Mean = 234.196
- Std.dev = 30.6939
- 1 item below graph minimum of 119.951
- 104 items above graph maximum of 351.928
|
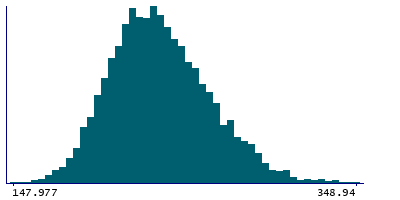
Instance 3 : First repeat imaging visit (2019+)
4,755 participants, 4,755 items
| Maximum | 568.761 |
| Decile 9 | 273.851 |
| Decile 8 | 258.227 |
| Decile 7 | 247.715 |
| Decile 6 | 239.053 |
| Median | 231.511 |
| Decile 4 | 224.509 |
| Decile 3 | 217.064 |
| Decile 2 | 209.139 |
| Decile 1 | 198.762 |
| Minimum | 147.977 |
|
|
- Mean = 234.385
- Std.dev = 30.4029
- 11 items above graph maximum of 348.94
|
Notes
Volume of CM in the left hemisphere generated by subcortical volumetric sub-segmentation of the Thalamic Nuclei
0 Related Data-Fields
There are no related data-fields
0 Resources
There are no matching Resources
