Data
87,996 items of data are available, covering 83,313 participants.
Defined-instances run from 2 to 3, labelled using Instancing
2.
Units of measurement are mm3.
| Maximum | 2211.37 |
| Decile 9 | 1036.77 |
| Decile 8 | 986.067 |
| Decile 7 | 951.31 |
| Decile 6 | 921.942 |
| Median | 895.551 |
| Decile 4 | 869.484 |
| Decile 3 | 843.188 |
| Decile 2 | 813.747 |
| Decile 1 | 773.419 |
| Minimum | 443.712 |
|
|
- Mean = 901.343
- Std.dev = 104.095
- 5 items below graph minimum of 510.072
- 64 items above graph maximum of 1300.11
|
2 Instances
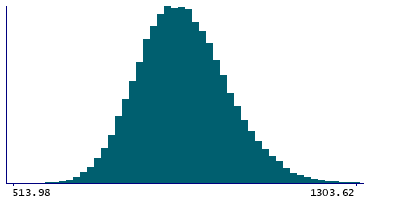
Instance 2 : Imaging visit (2014+)
83,241 participants, 83,241 items
| Maximum | 2211.37 |
| Decile 9 | 1036.61 |
| Decile 8 | 985.863 |
| Decile 7 | 951.026 |
| Decile 6 | 921.437 |
| Median | 894.936 |
| Decile 4 | 868.881 |
| Decile 3 | 842.666 |
| Decile 2 | 813.326 |
| Decile 1 | 772.894 |
| Minimum | 443.712 |
|

|
- Mean = 900.901
- Std.dev = 104.155
- 4 items below graph minimum of 509.177
- 59 items above graph maximum of 1300.33
|
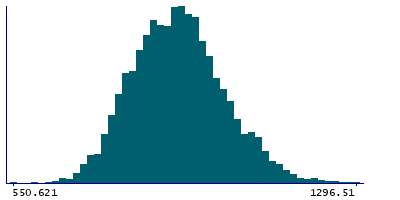
Instance 3 : First repeat imaging visit (2019+)
4,755 participants, 4,755 items
| Maximum | 2194.1 |
| Decile 9 | 1040.07 |
| Decile 8 | 989.139 |
| Decile 7 | 956.665 |
| Decile 6 | 929.803 |
| Median | 905.413 |
| Decile 4 | 878.736 |
| Decile 3 | 852.059 |
| Decile 2 | 822.818 |
| Decile 1 | 783.748 |
| Minimum | 550.621 |
|
|
- Mean = 909.091
- Std.dev = 102.734
- 4 items above graph maximum of 1296.39
|
Notes
Volume of PuM in the left hemisphere generated by subcortical volumetric sub-segmentation of the Thalamic Nuclei
0 Related Data-Fields
There are no related data-fields
0 Resources
There are no matching Resources
