Data
87,996 items of data are available, covering 83,313 participants.
Defined-instances run from 2 to 3, labelled using Instancing
2.
Units of measurement are mm3.
| Maximum | 10052.1 |
| Decile 9 | 4245.44 |
| Decile 8 | 4054.2 |
| Decile 7 | 3920.49 |
| Decile 6 | 3806.7 |
| Median | 3703.67 |
| Decile 4 | 3603.19 |
| Decile 3 | 3495.47 |
| Decile 2 | 3368.75 |
| Decile 1 | 3194.24 |
| Minimum | 992.955 |
|

|
- Mean = 3713.66
- Std.dev = 417.239
- 17 items below graph minimum of 2143.05
- 41 items above graph maximum of 5296.63
|
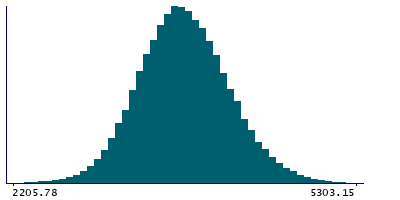
2 Instances
Instance 2 : Imaging visit (2014+)
83,241 participants, 83,241 items
| Maximum | 10052.1 |
| Decile 9 | 4242.01 |
| Decile 8 | 4050.53 |
| Decile 7 | 3917.05 |
| Decile 6 | 3802.58 |
| Median | 3699.65 |
| Decile 4 | 3598.82 |
| Decile 3 | 3491.11 |
| Decile 2 | 3364.84 |
| Decile 1 | 3189.48 |
| Minimum | 992.955 |
|
|
- Mean = 3709.71
- Std.dev = 417.755
- 15 items below graph minimum of 2136.96
- 39 items above graph maximum of 5294.53
|
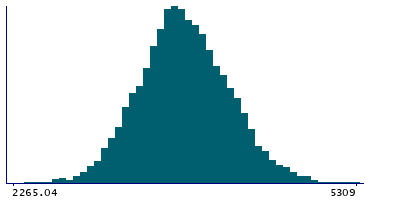
Instance 3 : First repeat imaging visit (2019+)
4,755 participants, 4,755 items
| Maximum | 5457.57 |
| Decile 9 | 4294.35 |
| Decile 8 | 4119.5 |
| Decile 7 | 3980.12 |
| Decile 6 | 3870.8 |
| Median | 3767.04 |
| Decile 4 | 3672.69 |
| Decile 3 | 3575.66 |
| Decile 2 | 3451.45 |
| Decile 1 | 3279.7 |
| Minimum | 2134.68 |
|
|
- Mean = 3782.78
- Std.dev = 401.87
- 2 items below graph minimum of 2265.04
- 3 items above graph maximum of 5309
|
Notes
Volume of Whole-hippocampus in the right hemisphere generated by subcortical volumetric sub-segmentation of the Hippocampal Subfields
0 Related Data-Fields
There are no related data-fields
0 Resources
There are no matching Resources
