Data
87,996 items of data are available, covering 83,313 participants.
Defined-instances run from 2 to 3, labelled using Instancing
2.
Units of measurement are mm3.
| Maximum | 237.317 |
| Decile 9 | 88.1784 |
| Decile 8 | 79.6553 |
| Decile 7 | 73.5965 |
| Decile 6 | 68.4772 |
| Median | 63.6434 |
| Decile 4 | 58.8856 |
| Decile 3 | 53.475 |
| Decile 2 | 46.9005 |
| Decile 1 | 37.3117 |
| Minimum | 0.274576 |
|
|
- Mean = 63.2812
- Std.dev = 20.2572
- 59 items above graph maximum of 139.045
|
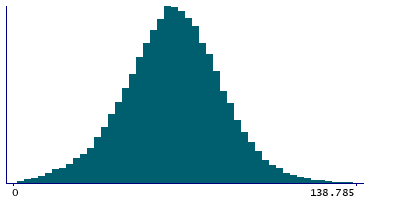
2 Instances
Instance 2 : Imaging visit (2014+)
83,241 participants, 83,241 items
| Maximum | 237.317 |
| Decile 9 | 88.0364 |
| Decile 8 | 79.5499 |
| Decile 7 | 73.4997 |
| Decile 6 | 68.3895 |
| Median | 63.5468 |
| Decile 4 | 58.7868 |
| Decile 3 | 53.3274 |
| Decile 2 | 46.7259 |
| Decile 1 | 37.1435 |
| Minimum | 0.274576 |
|

|
- Mean = 63.1452
- Std.dev = 20.2648
- 53 items above graph maximum of 138.929
|
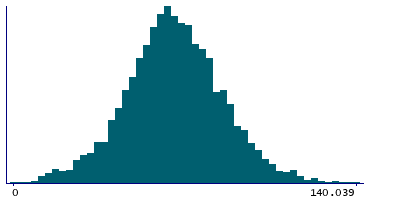
Instance 3 : First repeat imaging visit (2019+)
4,755 participants, 4,755 items
| Maximum | 199.725 |
| Decile 9 | 90.5473 |
| Decile 8 | 81.355 |
| Decile 7 | 75.4907 |
| Decile 6 | 70.0503 |
| Median | 65.2415 |
| Decile 4 | 60.7229 |
| Decile 3 | 55.88 |
| Decile 2 | 49.8309 |
| Decile 1 | 41.0552 |
| Minimum | 1.37194 |
|
|
- Mean = 65.6621
- Std.dev = 19.9747
- 5 items above graph maximum of 140.039
|
Notes
Volume of fimbria in the left hemisphere generated by subcortical volumetric sub-segmentation of the Hippocampal Subfields
0 Related Data-Fields
There are no related data-fields
0 Resources
There are no matching Resources
