Data
87,996 items of data are available, covering 83,313 participants.
Defined-instances run from 2 to 3, labelled using Instancing
2.
Units of measurement are mm3.
| Maximum | 299.207 |
| Decile 9 | 184.821 |
| Decile 8 | 175.184 |
| Decile 7 | 168.634 |
| Decile 6 | 162.934 |
| Median | 157.822 |
| Decile 4 | 152.719 |
| Decile 3 | 147.276 |
| Decile 2 | 140.813 |
| Decile 1 | 131.863 |
| Minimum | 35.1922 |
|
|
- Mean = 158.192
- Std.dev = 20.9841
- 15 items below graph minimum of 78.9038
- 42 items above graph maximum of 237.78
|
2 Instances
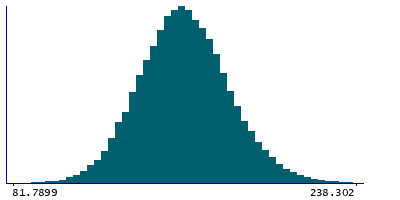
Instance 2 : Imaging visit (2014+)
83,241 participants, 83,241 items
| Maximum | 299.207 |
| Decile 9 | 184.655 |
| Decile 8 | 175.01 |
| Decile 7 | 168.45 |
| Decile 6 | 162.737 |
| Median | 157.612 |
| Decile 4 | 152.51 |
| Decile 3 | 147.065 |
| Decile 2 | 140.614 |
| Decile 1 | 131.585 |
| Minimum | 58.6828 |
|

|
- Mean = 157.991
- Std.dev = 20.9937
- 11 items below graph minimum of 78.5149
- 38 items above graph maximum of 237.726
|
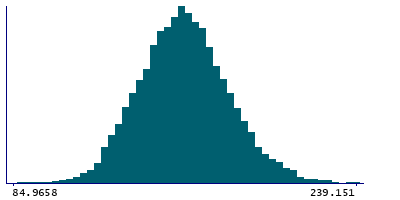
Instance 3 : First repeat imaging visit (2019+)
4,755 participants, 4,755 items
| Maximum | 283.904 |
| Decile 9 | 187.747 |
| Decile 8 | 178.158 |
| Decile 7 | 171.486 |
| Decile 6 | 166.154 |
| Median | 161.246 |
| Decile 4 | 156.3 |
| Decile 3 | 150.91 |
| Decile 2 | 145.152 |
| Decile 1 | 136.361 |
| Minimum | 35.1922 |
|
|
- Mean = 161.704
- Std.dev = 20.5006
- 4 items below graph minimum of 84.974
- 3 items above graph maximum of 239.134
|
Notes
Volume of GC-ML-DG-body in the left hemisphere generated by subcortical volumetric sub-segmentation of the Hippocampal Subfields
0 Related Data-Fields
There are no related data-fields
0 Resources
There are no matching Resources
