Data
87,996 items of data are available, covering 83,313 participants.
Defined-instances run from 2 to 3, labelled using Instancing
2.
Units of measurement are mm3.
| Maximum | 273.404 |
| Decile 9 | 168.586 |
| Decile 8 | 159.278 |
| Decile 7 | 152.778 |
| Decile 6 | 147.463 |
| Median | 142.619 |
| Decile 4 | 138.047 |
| Decile 3 | 133.061 |
| Decile 2 | 127.266 |
| Decile 1 | 119.079 |
| Minimum | 35.7052 |
|

|
- Mean = 143.353
- Std.dev = 19.9531
- 24 items below graph minimum of 69.5718
- 55 items above graph maximum of 218.093
|
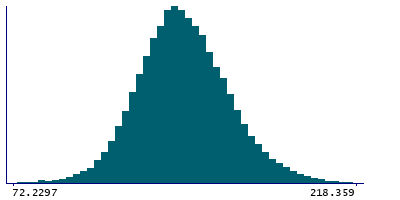
2 Instances
Instance 2 : Imaging visit (2014+)
83,241 participants, 83,241 items
| Maximum | 273.404 |
| Decile 9 | 168.441 |
| Decile 8 | 159.184 |
| Decile 7 | 152.679 |
| Decile 6 | 147.343 |
| Median | 142.49 |
| Decile 4 | 137.92 |
| Decile 3 | 132.92 |
| Decile 2 | 127.1 |
| Decile 1 | 118.913 |
| Minimum | 52.1634 |
|
|
- Mean = 143.219
- Std.dev = 19.9604
- 19 items below graph minimum of 69.3845
- 51 items above graph maximum of 217.97
|
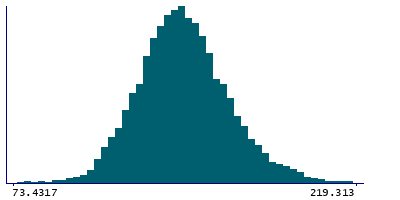
Instance 3 : First repeat imaging visit (2019+)
4,755 participants, 4,755 items
| Maximum | 228.061 |
| Decile 9 | 170.686 |
| Decile 8 | 161.188 |
| Decile 7 | 154.636 |
| Decile 6 | 149.633 |
| Median | 144.891 |
| Decile 4 | 140.301 |
| Decile 3 | 135.502 |
| Decile 2 | 130.054 |
| Decile 1 | 122.059 |
| Minimum | 35.7052 |
|
|
- Mean = 145.697
- Std.dev = 19.6777
- 5 items below graph minimum of 73.4317
- 4 items above graph maximum of 219.313
|
Notes
Volume of presubiculum-head in the left hemisphere generated by subcortical volumetric sub-segmentation of the Hippocampal Subfields
0 Related Data-Fields
There are no related data-fields
0 Resources
There are no matching Resources
