Data
87,996 items of data are available, covering 83,313 participants.
Defined-instances run from 2 to 3, labelled using Instancing
2.
Units of measurement are mm3.
| Maximum | 3851.44 |
| Decile 9 | 1983.75 |
| Decile 8 | 1885.58 |
| Decile 7 | 1816.9 |
| Decile 6 | 1760.24 |
| Median | 1707.82 |
| Decile 4 | 1657.6 |
| Decile 3 | 1604.27 |
| Decile 2 | 1543.2 |
| Decile 1 | 1459.1 |
| Minimum | 385.381 |
|
|
- Mean = 1715.24
- Std.dev = 208.993
- 17 items below graph minimum of 934.453
- 36 items above graph maximum of 2508.4
|
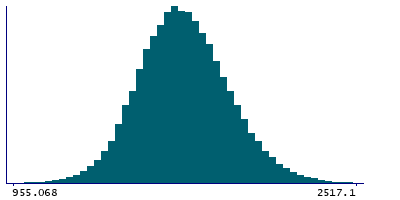
2 Instances
Instance 2 : Imaging visit (2014+)
83,241 participants, 83,241 items
| Maximum | 3851.44 |
| Decile 9 | 1982.7 |
| Decile 8 | 1884.43 |
| Decile 7 | 1815.61 |
| Decile 6 | 1758.56 |
| Median | 1706.11 |
| Decile 4 | 1656.05 |
| Decile 3 | 1602.47 |
| Decile 2 | 1541.5 |
| Decile 1 | 1457.32 |
| Minimum | 385.381 |
|

|
- Mean = 1713.73
- Std.dev = 209.288
- 16 items below graph minimum of 931.933
- 35 items above graph maximum of 2508.08
|
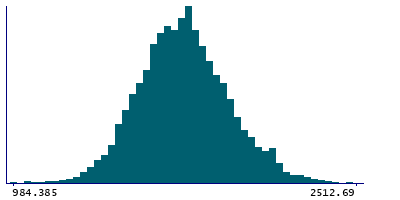
Instance 3 : First repeat imaging visit (2019+)
4,755 participants, 4,755 items
| Maximum | 2559.33 |
| Decile 9 | 2003.25 |
| Decile 8 | 1905.94 |
| Decile 7 | 1836.8 |
| Decile 6 | 1782.63 |
| Median | 1737.63 |
| Decile 4 | 1686.99 |
| Decile 3 | 1634.55 |
| Decile 2 | 1576.58 |
| Decile 1 | 1493.82 |
| Minimum | 855.271 |
|
|
- Mean = 1741.58
- Std.dev = 201.945
- 4 items below graph minimum of 984.385
- 1 item above graph maximum of 2512.69
|
Notes
Volume of Whole-amygdala in the right hemisphere generated by subcortical volumetric sub-segmentation of the Amygdala Nuclei
0 Related Data-Fields
There are no related data-fields
0 Resources
There are no matching Resources
