Data
87,996 items of data are available, covering 83,313 participants.
Defined-instances run from 2 to 3, labelled using Instancing
2.
Units of measurement are mm3.
| Maximum | 2726.21 |
| Decile 9 | 1888.1 |
| Decile 8 | 1793.91 |
| Decile 7 | 1728.94 |
| Decile 6 | 1674.44 |
| Median | 1625 |
| Decile 4 | 1576.12 |
| Decile 3 | 1524.73 |
| Decile 2 | 1466.54 |
| Decile 1 | 1386.48 |
| Minimum | 435.164 |
|
|
- Mean = 1631.48
- Std.dev = 200.102
- 28 items below graph minimum of 884.864
- 34 items above graph maximum of 2389.72
|
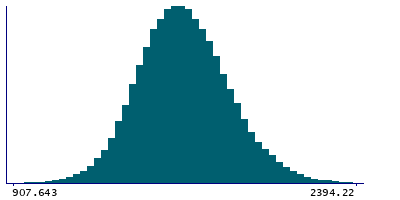
2 Instances
Instance 2 : Imaging visit (2014+)
83,241 participants, 83,241 items
| Maximum | 2726.21 |
| Decile 9 | 1886.48 |
| Decile 8 | 1792.59 |
| Decile 7 | 1727.78 |
| Decile 6 | 1673.09 |
| Median | 1623.77 |
| Decile 4 | 1574.56 |
| Decile 3 | 1523 |
| Decile 2 | 1464.6 |
| Decile 1 | 1384.5 |
| Minimum | 670.548 |
|

|
- Mean = 1630.06
- Std.dev = 200.196
- 21 items below graph minimum of 882.514
- 31 items above graph maximum of 2388.46
|
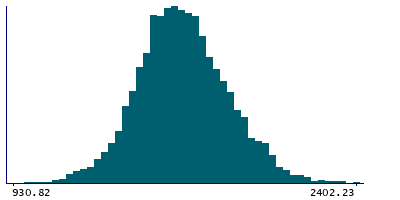
Instance 3 : First repeat imaging visit (2019+)
4,755 participants, 4,755 items
| Maximum | 2481.3 |
| Decile 9 | 1911.76 |
| Decile 8 | 1816.01 |
| Decile 7 | 1749.04 |
| Decile 6 | 1696.3 |
| Median | 1648.64 |
| Decile 4 | 1601.95 |
| Decile 3 | 1552.24 |
| Decile 2 | 1500.55 |
| Decile 1 | 1421.29 |
| Minimum | 435.164 |
|
|
- Mean = 1656.4
- Std.dev = 196.793
- 7 items below graph minimum of 930.82
- 2 items above graph maximum of 2402.23
|
Notes
Volume of Whole-amygdala in the left hemisphere generated by subcortical volumetric sub-segmentation of the Amygdala Nuclei
0 Related Data-Fields
There are no related data-fields
0 Resources
There are no matching Resources
