Data
84,479 items of data are available, covering 79,921 participants.
Defined-instances run from 2 to 3, labelled using Instancing
2.
Units of measurement are units.
| Maximum | 10.877 |
| Decile 9 | 1.48282 |
| Decile 8 | 1.13177 |
| Decile 7 | 0.971706 |
| Decile 6 | 0.865096 |
| Median | 0.777765 |
| Decile 4 | 0.70608 |
| Decile 3 | 0.645782 |
| Decile 2 | 0.58229 |
| Decile 1 | 0.459118 |
| Minimum | 0.118136 |
|
|
- Mean = 0.895675
- Std.dev = 0.451417
- 268 items above graph maximum of 2.50651
|
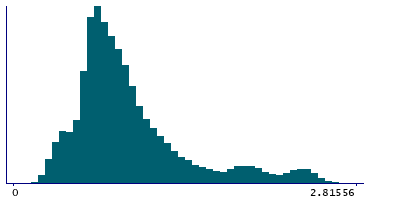
2 Instances
Instance 2 : Imaging visit (2014+)
79,719 participants, 79,719 items
| Maximum | 10.877 |
| Decile 9 | 1.50803 |
| Decile 8 | 1.14985 |
| Decile 7 | 0.987849 |
| Decile 6 | 0.88019 |
| Median | 0.789679 |
| Decile 4 | 0.712891 |
| Decile 3 | 0.649488 |
| Decile 2 | 0.584924 |
| Decile 1 | 0.462974 |
| Minimum | 0.118136 |
|

|
- Mean = 0.90617
- Std.dev = 0.456842
- 125 items above graph maximum of 2.55309
|
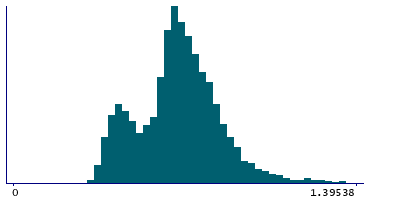
Instance 3 : First repeat imaging visit (2019+)
4,760 participants, 4,760 items
| Maximum | 3.03051 |
| Decile 9 | 0.916385 |
| Decile 8 | 0.813167 |
| Decile 7 | 0.758314 |
| Decile 6 | 0.71489 |
| Median | 0.678238 |
| Decile 4 | 0.644775 |
| Decile 3 | 0.607233 |
| Decile 2 | 0.530705 |
| Decile 1 | 0.436518 |
| Minimum | 0.299351 |
|
|
- Mean = 0.71991
- Std.dev = 0.297525
- 185 items above graph maximum of 1.39625
|
Notes
Standard deviation of apparent translation in the Y axis as measured by eddy
0 Related Data-Fields
There are no related data-fields


