Data
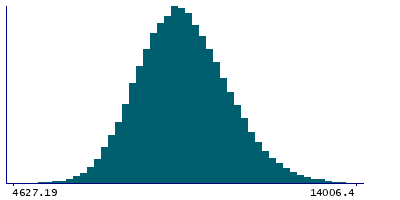
86,652 items of data are available, covering 82,007 participants.
Defined-instances run from 2 to 3, labelled using Instancing
2.
Units of measurement are mm3.
| Maximum | 17952.1 |
| Decile 9 | 10824.5 |
| Decile 8 | 10225.7 |
| Decile 7 | 9807.21 |
| Decile 6 | 9462.38 |
| Median | 9153.67 |
| Decile 4 | 8848.47 |
| Decile 3 | 8528.85 |
| Decile 2 | 8168.88 |
| Decile 1 | 7687.24 |
| Minimum | 586.141 |
|

|
- Mean = 9210.51
- Std.dev = 1242.75
- 24 items below graph minimum of 4549.94
- 68 items above graph maximum of 13961.8
|
2 Instances
Instance 2 : Imaging visit (2014+)
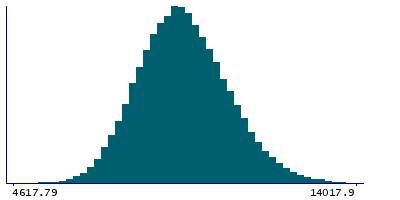
81,871 participants, 81,871 items
| Maximum | 17952.1 |
| Decile 9 | 10824.2 |
| Decile 8 | 10225.6 |
| Decile 7 | 9804.91 |
| Decile 6 | 9459.74 |
| Median | 9150.28 |
| Decile 4 | 8845.69 |
| Decile 3 | 8525.71 |
| Decile 2 | 8164.36 |
| Decile 1 | 7681.57 |
| Minimum | 586.141 |
|

|
- Mean = 9207.73
- Std.dev = 1244.75
- 23 items below graph minimum of 4538.95
- 64 items above graph maximum of 13966.8
|
Instance 3 : First repeat imaging visit (2019+)
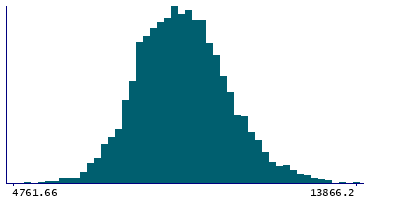
4,781 participants, 4,781 items
| Maximum | 15612.8 |
| Decile 9 | 10831.4 |
| Decile 8 | 10229.5 |
| Decile 7 | 9832.95 |
| Decile 6 | 9515.51 |
| Median | 9216.23 |
| Decile 4 | 8906.6 |
| Decile 3 | 8583.12 |
| Decile 2 | 8234.08 |
| Decile 1 | 7796.52 |
| Minimum | 3966.65 |
|

|
- Mean = 9258.12
- Std.dev = 1207.02
- 1 item below graph minimum of 4761.66
- 4 items above graph maximum of 13866.2
|
Notes
Volume of grey matter in Right Temporal Pole
0 Related Data-Fields
There are no related data-fields
0 Resources
There are no matching Resources
2 Applications
| Application ID | Title |
|---|
| 17689 | Genetic, environmental and lifestyle predictors of brain/cognitive-related outcomes. |
| 22783 | The joint analysis of imaging data and genetic data for early tumor detection, prevention, diagnosis and treatment |


