Data
85,026 items of data are available, covering 80,456 participants.
Defined-instances run from 2 to 3, labelled using Instancing
2.
Units of measurement are AU.
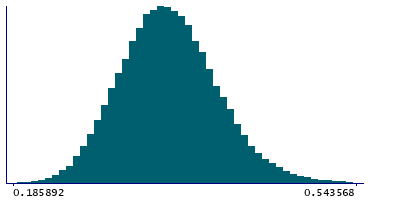
| Maximum | 0.932425 |
| Decile 9 | 0.411667 |
| Decile 8 | 0.386605 |
| Decile 7 | 0.36953 |
| Decile 6 | 0.355405 |
| Median | 0.342256 |
| Decile 4 | 0.329415 |
| Decile 3 | 0.315894 |
| Decile 2 | 0.300372 |
| Decile 1 | 0.27969 |
| Minimum | 0.183806 |
|
|
- Mean = 0.344846
- Std.dev = 0.053066
- 171 items above graph maximum of 0.543645
|
2 Instances
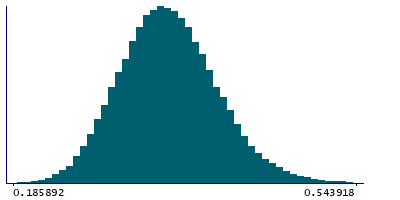
Instance 2 : Imaging visit (2014+)
80,266 participants, 80,266 items
| Maximum | 0.920159 |
| Decile 9 | 0.41155 |
| Decile 8 | 0.386452 |
| Decile 7 | 0.369264 |
| Decile 6 | 0.355036 |
| Median | 0.341813 |
| Decile 4 | 0.328981 |
| Decile 3 | 0.315485 |
| Decile 2 | 0.29996 |
| Decile 1 | 0.279268 |
| Minimum | 0.183806 |
|
|
- Mean = 0.344529
- Std.dev = 0.053148
- 164 items above graph maximum of 0.543832
|
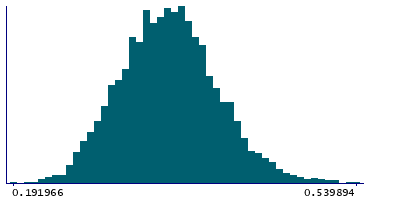
Instance 3 : First repeat imaging visit (2019+)
4,760 participants, 4,760 items
| Maximum | 0.932425 |
| Decile 9 | 0.41363 |
| Decile 8 | 0.389493 |
| Decile 7 | 0.374189 |
| Decile 6 | 0.360954 |
| Median | 0.348616 |
| Decile 4 | 0.335995 |
| Decile 3 | 0.323077 |
| Decile 2 | 0.308256 |
| Decile 1 | 0.287287 |
| Minimum | 0.191966 |
|
|
- Mean = 0.350182
- Std.dev = 0.0513709
- 8 items above graph maximum of 0.539973
|
Notes
Discrepancy between the T2 FLAIR brain image (linearly-aligned to the T1) and the T1 brain image
0 Related Data-Fields
There are no related data-fields
2 Applications
| Application ID | Title |
|---|
| 17689 | Genetic, environmental and lifestyle predictors of brain/cognitive-related outcomes. |
| 22783 | The joint analysis of imaging data and genetic data for early tumor detection, prevention, diagnosis and treatment |


