Data
86,657 items of data are available, covering 82,012 participants.
Defined-instances run from 2 to 3, labelled using Instancing
2.
Units of measurement are ratio.
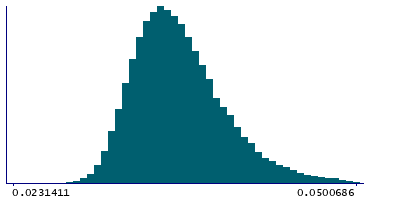
| Maximum | 0.0611072 |
| Decile 9 | 0.0412027 |
| Decile 8 | 0.0390521 |
| Decile 7 | 0.0377153 |
| Decile 6 | 0.0366713 |
| Median | 0.0357839 |
| Decile 4 | 0.0349415 |
| Decile 3 | 0.0341254 |
| Decile 2 | 0.0332399 |
| Decile 1 | 0.0321209 |
| Minimum | 0.0231411 |
|
|
- Mean = 0.0363176
- Std.dev = 0.00373417
- 326 items above graph maximum of 0.0502844
|
2 Instances
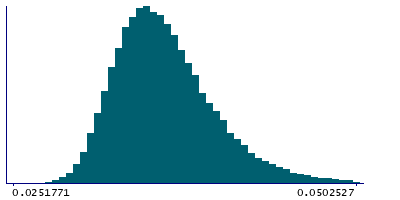
Instance 2 : Imaging visit (2014+)
81,876 participants, 81,876 items
| Maximum | 0.0611072 |
| Decile 9 | 0.0412904 |
| Decile 8 | 0.0391406 |
| Decile 7 | 0.0377883 |
| Decile 6 | 0.036735 |
| Median | 0.0358461 |
| Decile 4 | 0.0349999 |
| Decile 3 | 0.0341787 |
| Decile 2 | 0.0332956 |
| Decile 1 | 0.0321647 |
| Minimum | 0.0251771 |
|
|
- Mean = 0.0363846
- Std.dev = 0.00375277
- 300 items above graph maximum of 0.050416
|
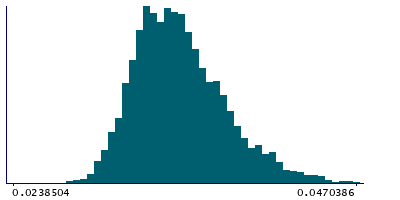
Instance 3 : First repeat imaging visit (2019+)
4,781 participants, 4,781 items
| Maximum | 0.0549295 |
| Decile 9 | 0.0393092 |
| Decile 8 | 0.0375973 |
| Decile 7 | 0.0364076 |
| Decile 6 | 0.0355095 |
| Median | 0.034757 |
| Decile 4 | 0.034025 |
| Decile 3 | 0.0332533 |
| Decile 2 | 0.0325279 |
| Decile 1 | 0.0315798 |
| Minimum | 0.0231411 |
|
|
- Mean = 0.0351691
- Std.dev = 0.00318809
- 1 item below graph minimum of 0.0238504
- 19 items above graph maximum of 0.0470386
|
Notes
Inverted contrast-to-noise ratio in the T1 - background spatial standard deviation divided by contrast between white and grey matter mean intensities
0 Related Data-Fields
There are no related data-fields
2 Applications
| Application ID | Title |
|---|
| 17689 | Genetic, environmental and lifestyle predictors of brain/cognitive-related outcomes. |
| 22783 | The joint analysis of imaging data and genetic data for early tumor detection, prevention, diagnosis and treatment |


