Data
86,657 items of data are available, covering 82,012 participants.
Defined-instances run from 2 to 3, labelled using Instancing
2.
Units of measurement are AU.
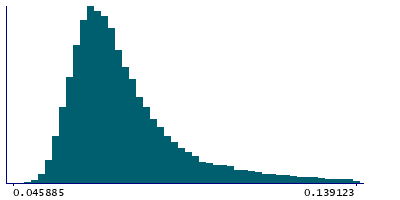
| Maximum | 0.539303 |
| Decile 9 | 0.105519 |
| Decile 8 | 0.0896185 |
| Decile 7 | 0.0821575 |
| Decile 6 | 0.077396 |
| Median | 0.073786 |
| Decile 4 | 0.070857 |
| Decile 3 | 0.0681295 |
| Decile 2 | 0.065381 |
| Decile 1 | 0.06208 |
| Minimum | 0.045885 |
|
|
- Mean = 0.0807293
- Std.dev = 0.0258173
- 2097 items above graph maximum of 0.148958
|
2 Instances
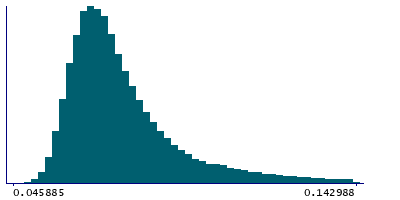
Instance 2 : Imaging visit (2014+)
81,876 participants, 81,876 items
| Maximum | 0.539303 |
| Decile 9 | 0.105834 |
| Decile 8 | 0.08981 |
| Decile 7 | 0.0822845 |
| Decile 6 | 0.0774705 |
| Median | 0.073852 |
| Decile 4 | 0.070912 |
| Decile 3 | 0.068171 |
| Decile 2 | 0.0654165 |
| Decile 1 | 0.062103 |
| Minimum | 0.045885 |
|
|
- Mean = 0.0808684
- Std.dev = 0.0260441
- 1986 items above graph maximum of 0.149565
|
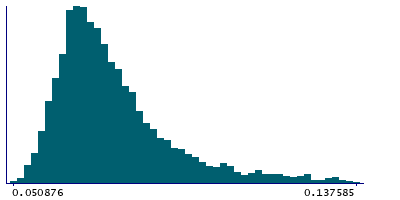
Instance 3 : First repeat imaging visit (2019+)
4,781 participants, 4,781 items
| Maximum | 0.332999 |
| Decile 9 | 0.0996455 |
| Decile 8 | 0.0865965 |
| Decile 7 | 0.0803015 |
| Decile 6 | 0.0760455 |
| Median | 0.072792 |
| Decile 4 | 0.0698915 |
| Decile 3 | 0.0674085 |
| Decile 2 | 0.064969 |
| Decile 1 | 0.0617055 |
| Minimum | 0.050876 |
|
|
- Mean = 0.0783472
- Std.dev = 0.0214267
- 114 items above graph maximum of 0.137585
|
Notes
Amount of warping (averaged distortion) applied to nonlinearly align the T1 brain image to standard-space
0 Related Data-Fields
There are no related data-fields
2 Applications
| Application ID | Title |
|---|
| 17689 | Genetic, environmental and lifestyle predictors of brain/cognitive-related outcomes. |
| 22783 | The joint analysis of imaging data and genetic data for early tumor detection, prevention, diagnosis and treatment |


