Data
86,640 items of data are available, covering 81,995 participants.
Defined-instances run from 2 to 3, labelled using Instancing
2.
Units of measurement are mm3.
| Maximum | 4879 |
| Decile 9 | 1553 |
| Decile 8 | 1437 |
| Decile 7 | 1355 |
| Decile 6 | 1283 |
| Median | 1218 |
| Decile 4 | 1149 |
| Decile 3 | 1076 |
| Decile 2 | 988 |
| Decile 1 | 867 |
| Minimum | 239 |
|

|
- Mean = 1216
- Std.dev = 272.4
- 114 items above graph maximum of 2239
|
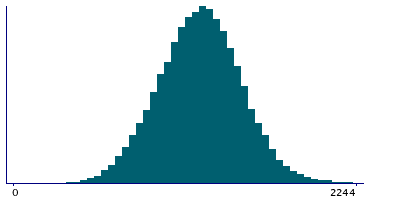
2 Instances
Instance 2 : Imaging visit (2014+)
81,859 participants, 81,859 items
| Maximum | 4879 |
| Decile 9 | 1554 |
| Decile 8 | 1438 |
| Decile 7 | 1355 |
| Decile 6 | 1284 |
| Median | 1218 |
| Decile 4 | 1149 |
| Decile 3 | 1076 |
| Decile 2 | 989 |
| Decile 1 | 867 |
| Minimum | 239 |
|
|
- Mean = 1216.31
- Std.dev = 272.645
- 108 items above graph maximum of 2241
|
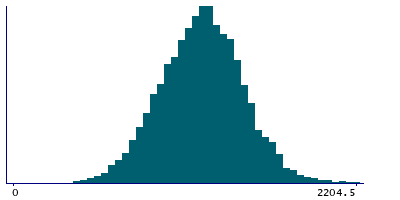
Instance 3 : First repeat imaging visit (2019+)
4,781 participants, 4,781 items
| Maximum | 3188 |
| Decile 9 | 1536 |
| Decile 8 | 1425 |
| Decile 7 | 1350 |
| Decile 6 | 1278 |
| Median | 1214 |
| Decile 4 | 1148 |
| Decile 3 | 1075 |
| Decile 2 | 984 |
| Decile 1 | 868 |
| Minimum | 389 |
|
|
- Mean = 1210.71
- Std.dev = 268.112
- 6 items above graph maximum of 2204
|
Notes
Volume of right amygdala (from T1 brain image)
0 Related Data-Fields
There are no related data-fields
0 Resources
There are no matching Resources
2 Applications
| Application ID | Title |
|---|
| 17689 | Genetic, environmental and lifestyle predictors of brain/cognitive-related outcomes. |
| 22783 | The joint analysis of imaging data and genetic data for early tumor detection, prevention, diagnosis and treatment |
