Data
86,657 items of data are available, covering 82,012 participants.
Defined-instances run from 2 to 3, labelled using Instancing
2.
Units of measurement are mm3.
| Maximum | 881855 |
| Decile 9 | 679274 |
| Decile 8 | 652823 |
| Decile 7 | 633824 |
| Decile 6 | 617827 |
| Median | 603025 |
| Decile 4 | 588722 |
| Decile 3 | 573522 |
| Decile 2 | 556313 |
| Decile 1 | 533317 |
| Minimum | 360522 |
|
|
- Mean = 604887
- Std.dev = 56994.7
- 2 items below graph minimum of 387361
- 20 items above graph maximum of 825231
|
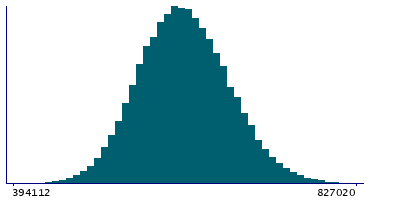
2 Instances
Instance 2 : Imaging visit (2014+)
81,876 participants, 81,876 items
| Maximum | 881855 |
| Decile 9 | 678772 |
| Decile 8 | 652304 |
| Decile 7 | 633294 |
| Decile 6 | 617235 |
| Median | 602437 |
| Decile 4 | 588216 |
| Decile 3 | 572993 |
| Decile 2 | 555789 |
| Decile 1 | 532753 |
| Minimum | 360522 |
|

|
- Mean = 604342
- Std.dev = 57024.3
- 2 items below graph minimum of 386734
- 18 items above graph maximum of 824791
|
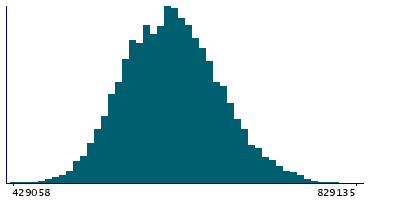
Instance 3 : First repeat imaging visit (2019+)
4,781 participants, 4,781 items
| Maximum | 836600 |
| Decile 9 | 686553 |
| Decile 8 | 660709 |
| Decile 7 | 642632 |
| Decile 6 | 626750 |
| Median | 612849 |
| Decile 4 | 598467 |
| Decile 3 | 582631 |
| Decile 2 | 565664 |
| Decile 1 | 543971 |
| Minimum | 429058 |
|
|
- Mean = 614224
- Std.dev = 55663.3
- 2 items above graph maximum of 829135
|
Notes
Volume of grey matter (from T1 brain image)
0 Related Data-Fields
There are no related data-fields
2 Applications
| Application ID | Title |
|---|
| 17689 | Genetic, environmental and lifestyle predictors of brain/cognitive-related outcomes. |
| 22783 | The joint analysis of imaging data and genetic data for early tumor detection, prevention, diagnosis and treatment |


