Data
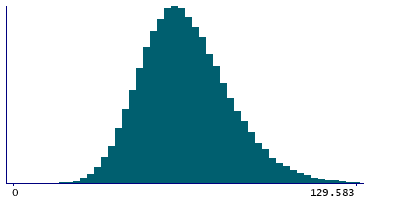
77,958 items of data are available, covering 73,705 participants.
Defined-instances run from 2 to 3, labelled using Instancing
2.
| Maximum | 168.184 |
| Decile 9 | 87.4323 |
| Decile 8 | 78.6881 |
| Decile 7 | 72.8386 |
| Decile 6 | 68.0415 |
| Median | 63.7448 |
| Decile 4 | 59.7277 |
| Decile 3 | 55.6197 |
| Decile 2 | 50.9121 |
| Decile 1 | 44.8856 |
| Minimum | 0 |
|

|
- Mean = 65.2325
- Std.dev = 16.9165
- 107 items above graph maximum of 129.979
|
2 Instances
Instance 2 : Imaging visit (2014+)
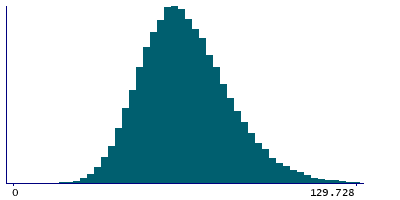
73,327 participants, 73,327 items
| Maximum | 168.184 |
| Decile 9 | 87.4939 |
| Decile 8 | 78.7478 |
| Decile 7 | 72.8679 |
| Decile 6 | 68.0757 |
| Median | 63.7245 |
| Decile 4 | 59.7145 |
| Decile 3 | 55.6169 |
| Decile 2 | 50.8838 |
| Decile 1 | 44.8696 |
| Minimum | 0 |
|

|
- Mean = 65.2517
- Std.dev = 16.9593
- 101 items above graph maximum of 130.118
|
Instance 3 : First repeat imaging visit (2019+)
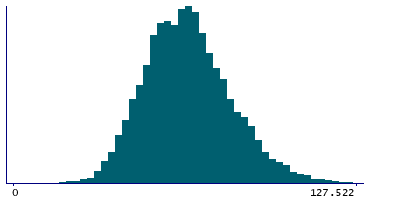
4,631 participants, 4,631 items
| Maximum | 146.437 |
| Decile 9 | 86.3287 |
| Decile 8 | 77.8621 |
| Decile 7 | 72.0854 |
| Decile 6 | 67.7078 |
| Median | 63.9286 |
| Decile 4 | 59.9387 |
| Decile 3 | 55.7147 |
| Decile 2 | 51.24 |
| Decile 1 | 45.135 |
| Minimum | 17.0814 |
|

|
- Mean = 64.9281
- Std.dev = 16.2203
- 7 items above graph maximum of 127.522
|
Notes
Median magnetic susceptibility in right substantia nigra (from QSM processing of SWI data)
0 Related Data-Fields
There are no related data-fields


