Data
77,958 items of data are available, covering 73,705 participants.
Defined-instances run from 2 to 3, labelled using Instancing
2.
| Maximum | 172.959 |
| Decile 9 | 86.6331 |
| Decile 8 | 77.8179 |
| Decile 7 | 72.0564 |
| Decile 6 | 67.3413 |
| Median | 63.1762 |
| Decile 4 | 59.2483 |
| Decile 3 | 55.1045 |
| Decile 2 | 50.5382 |
| Decile 1 | 44.6634 |
| Minimum | 0 |
|

|
- Mean = 64.6709
- Std.dev = 16.689
- 109 items above graph maximum of 128.603
|
2 Instances
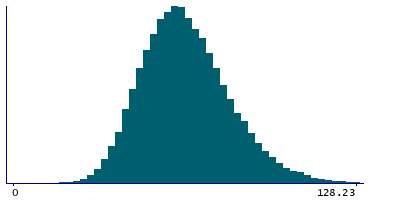
Instance 2 : Imaging visit (2014+)
73,327 participants, 73,327 items
| Maximum | 172.959 |
| Decile 9 | 86.6605 |
| Decile 8 | 77.8288 |
| Decile 7 | 72.062 |
| Decile 6 | 67.3524 |
| Median | 63.1729 |
| Decile 4 | 59.2299 |
| Decile 3 | 55.0807 |
| Decile 2 | 50.501 |
| Decile 1 | 44.6153 |
| Minimum | 0 |
|
|
- Mean = 64.6669
- Std.dev = 16.7167
- 101 items above graph maximum of 128.706
|
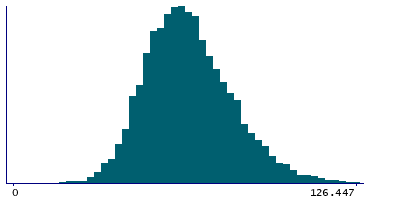
Instance 3 : First repeat imaging visit (2019+)
4,631 participants, 4,631 items
| Maximum | 155.707 |
| Decile 9 | 85.9374 |
| Decile 8 | 77.6086 |
| Decile 7 | 71.8814 |
| Decile 6 | 67.2015 |
| Median | 63.2115 |
| Decile 4 | 59.4567 |
| Decile 3 | 55.4642 |
| Decile 2 | 51.1926 |
| Decile 1 | 45.4278 |
| Minimum | 16.7885 |
|
|
- Mean = 64.7345
- Std.dev = 16.2443
- 9 items above graph maximum of 126.447
|
Notes
Median magnetic susceptibility in left substantia nigra (from QSM processing of SWI data)
0 Related Data-Fields
There are no related data-fields


