Data
77,958 items of data are available, covering 73,705 participants.
Defined-instances run from 2 to 3, labelled using Instancing
2.
| Maximum | 103.818 |
| Decile 9 | 3.34344 |
| Decile 8 | -0.0773075 |
| Decile 7 | -2.51708 |
| Decile 6 | -5.76807 |
| Median | -9.02465 |
| Decile 4 | -12.3199 |
| Decile 3 | -15.8499 |
| Decile 2 | -19.9944 |
| Decile 1 | -25.9102 |
| Minimum | -97.6203 |
|

|
- Mean = -10.0253
- Std.dev = 12.4315
- 161 items below graph minimum of -55.1639
- 109 items above graph maximum of 32.5971
|
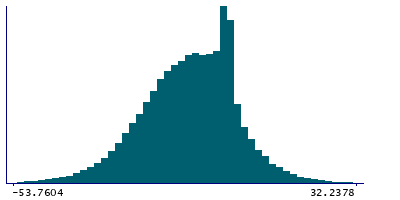
2 Instances
Instance 2 : Imaging visit (2014+)
73,327 participants, 73,327 items
| Maximum | 103.818 |
| Decile 9 | 3.29586 |
| Decile 8 | -0.0877695 |
| Decile 7 | -2.54094 |
| Decile 6 | -5.83125 |
| Median | -9.09261 |
| Decile 4 | -12.4059 |
| Decile 3 | -15.9437 |
| Decile 2 | -20.1102 |
| Decile 1 | -26.0345 |
| Minimum | -97.6203 |
|
|
- Mean = -10.097
- Std.dev = 12.4791
- 154 items below graph minimum of -55.3648
- 105 items above graph maximum of 32.6262
|
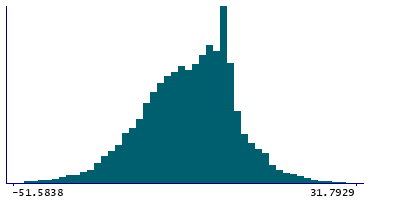
Instance 3 : First repeat imaging visit (2019+)
4,631 participants, 4,631 items
| Maximum | 43.7747 |
| Decile 9 | 4.00064 |
| Decile 8 | 0.000997 |
| Decile 7 | -2.07462 |
| Decile 6 | -4.86985 |
| Median | -7.897 |
| Decile 4 | -11.0663 |
| Decile 3 | -14.4483 |
| Decile 2 | -18.2217 |
| Decile 1 | -23.7916 |
| Minimum | -61.2438 |
|
|
- Mean = -8.88941
- Std.dev = 11.592
- 9 items below graph minimum of -51.5838
- 5 items above graph maximum of 31.7929
|
Notes
Median magnetic susceptibility in right accumbens (from QSM processing of SWI data)
0 Related Data-Fields
There are no related data-fields


