Data
77,958 items of data are available, covering 73,705 participants.
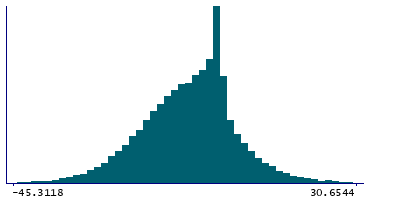
Defined-instances run from 2 to 3, labelled using Instancing
2.
| Maximum | 86.1008 |
| Decile 9 | 5.12917 |
| Decile 8 | 0.616078 |
| Decile 7 | -0.731881 |
| Decile 6 | -2.9973 |
| Median | -5.63517 |
| Decile 4 | -8.5138 |
| Decile 3 | -11.6102 |
| Decile 2 | -15.2716 |
| Decile 1 | -20.6093 |
| Minimum | -99.5903 |
|
|
- Mean = -6.72668
- Std.dev = 10.8261
- 115 items below graph minimum of -46.3477
- 133 items above graph maximum of 30.8676
|
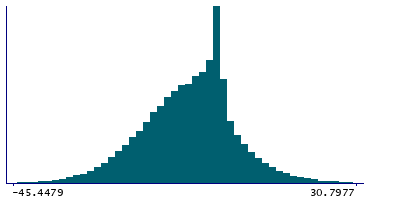
2 Instances
Instance 2 : Imaging visit (2014+)
73,327 participants, 73,327 items
| Maximum | 84.1851 |
| Decile 9 | 5.14397 |
| Decile 8 | 0.617911 |
| Decile 7 | -0.715126 |
| Decile 6 | -2.97067 |
| Median | -5.63109 |
| Decile 4 | -8.51809 |
| Decile 3 | -11.6175 |
| Decile 2 | -15.3052 |
| Decile 1 | -20.6848 |
| Minimum | -99.5903 |
|
|
- Mean = -6.73134
- Std.dev = 10.8646
- 108 items below graph minimum of -46.5135
- 124 items above graph maximum of 30.9727
|
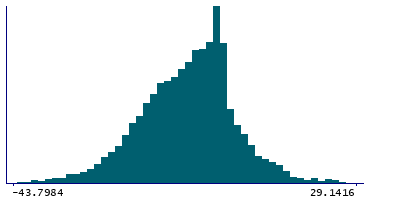
Instance 3 : First repeat imaging visit (2019+)
4,631 participants, 4,631 items
| Maximum | 86.1008 |
| Decile 9 | 4.8283 |
| Decile 8 | 0.584939 |
| Decile 7 | -1.09222 |
| Decile 6 | -3.35062 |
| Median | -5.70608 |
| Decile 4 | -8.43958 |
| Decile 3 | -11.4748 |
| Decile 2 | -14.7983 |
| Decile 1 | -19.485 |
| Minimum | -72.322 |
|
|
- Mean = -6.65293
- Std.dev = 10.1955
- 4 items below graph minimum of -43.7984
- 6 items above graph maximum of 29.1416
|
Notes
Median magnetic susceptibility in left accumbens (from QSM processing of SWI data)
0 Related Data-Fields
There are no related data-fields


