Data
77,958 items of data are available, covering 73,705 participants.
Defined-instances run from 2 to 3, labelled using Instancing
2.
| Maximum | 74.0728 |
| Decile 9 | 3.33336 |
| Decile 8 | -0.720159 |
| Decile 7 | -3.47388 |
| Decile 6 | -5.77632 |
| Median | -7.92324 |
| Decile 4 | -10.0644 |
| Decile 3 | -12.2847 |
| Decile 2 | -14.9623 |
| Decile 1 | -18.789 |
| Minimum | -67.2932 |
|

|
- Mean = -7.81558
- Std.dev = 9.05576
- 88 items below graph minimum of -40.9114
- 144 items above graph maximum of 25.4557
|
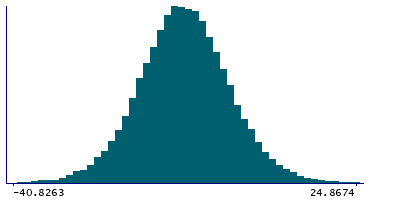
2 Instances
Instance 2 : Imaging visit (2014+)
73,327 participants, 73,327 items
| Maximum | 74.0728 |
| Decile 9 | 3.38276 |
| Decile 8 | -0.681761 |
| Decile 7 | -3.44863 |
| Decile 6 | -5.75892 |
| Median | -7.90371 |
| Decile 4 | -10.0468 |
| Decile 3 | -12.2795 |
| Decile 2 | -14.9843 |
| Decile 1 | -18.7967 |
| Minimum | -67.2932 |
|
|
- Mean = -7.79646
- Std.dev = 9.07477
- 79 items below graph minimum of -40.9763
- 134 items above graph maximum of 25.5623
|
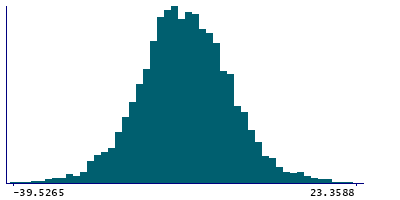
Instance 3 : First repeat imaging visit (2019+)
4,631 participants, 4,631 items
| Maximum | 41.9908 |
| Decile 9 | 2.397 |
| Decile 8 | -1.33973 |
| Decile 7 | -3.851 |
| Decile 6 | -6.16525 |
| Median | -8.17797 |
| Decile 4 | -10.3312 |
| Decile 3 | -12.3577 |
| Decile 2 | -14.7424 |
| Decile 1 | -18.5524 |
| Minimum | -56.1427 |
|
|
- Mean = -8.11846
- Std.dev = 8.74367
- 8 items below graph minimum of -39.5019
- 9 items above graph maximum of 23.3464
|
Notes
Median magnetic susceptibility in left amygdala (from QSM processing of SWI data)
0 Related Data-Fields
There are no related data-fields


