Data
77,958 items of data are available, covering 73,705 participants.
Defined-instances run from 2 to 3, labelled using Instancing
2.
| Maximum | 192.184 |
| Decile 9 | 48.8689 |
| Decile 8 | 41.4828 |
| Decile 7 | 36.7855 |
| Decile 6 | 32.8761 |
| Median | 29.4482 |
| Decile 4 | 26.159 |
| Decile 3 | 22.859 |
| Decile 2 | 19.0809 |
| Decile 1 | 14.1412 |
| Minimum | -34.436 |
|

|
- Mean = 30.7441
- Std.dev = 14.0879
- 7 items below graph minimum of -20.5865
- 198 items above graph maximum of 83.5966
|
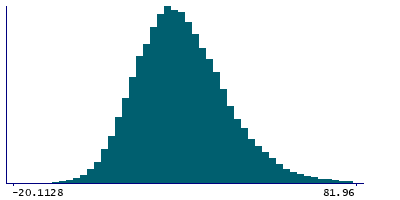
2 Instances
Instance 2 : Imaging visit (2014+)
73,327 participants, 73,327 items
| Maximum | 192.184 |
| Decile 9 | 48.9552 |
| Decile 8 | 41.5843 |
| Decile 7 | 36.8872 |
| Decile 6 | 32.9701 |
| Median | 29.557 |
| Decile 4 | 26.24 |
| Decile 3 | 22.9336 |
| Decile 2 | 19.1471 |
| Decile 1 | 14.2004 |
| Minimum | -34.436 |
|
|
- Mean = 30.8342
- Std.dev = 14.1301
- 7 items below graph minimum of -20.5544
- 193 items above graph maximum of 83.71
|
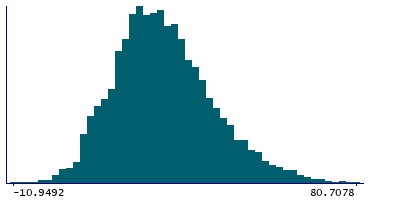
Instance 3 : First repeat imaging visit (2019+)
4,631 participants, 4,631 items
| Maximum | 106.315 |
| Decile 9 | 46.9133 |
| Decile 8 | 39.6876 |
| Decile 7 | 35.0039 |
| Decile 6 | 31.3723 |
| Median | 28.0742 |
| Decile 4 | 24.8494 |
| Decile 3 | 21.751 |
| Decile 2 | 18.22 |
| Decile 1 | 13.1187 |
| Minimum | -10.9492 |
|
|
- Mean = 29.317
- Std.dev = 13.3209
- 5 items above graph maximum of 80.7078
|
Notes
Median magnetic susceptibility in right caudate (from QSM processing of SWI data)
0 Related Data-Fields
There are no related data-fields


