Data
77,958 items of data are available, covering 73,705 participants.
Defined-instances run from 2 to 3, labelled using Instancing
2.
| Maximum | 184.385 |
| Decile 9 | 49.1775 |
| Decile 8 | 41.7354 |
| Decile 7 | 36.8685 |
| Decile 6 | 33.0437 |
| Median | 29.6434 |
| Decile 4 | 26.3635 |
| Decile 3 | 23.0559 |
| Decile 2 | 19.1601 |
| Decile 1 | 14.151 |
| Minimum | -34.0543 |
|
|
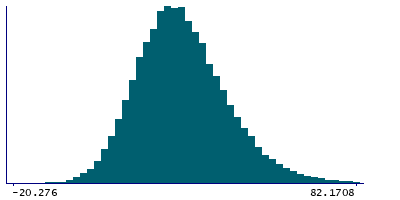
- Mean = 30.8932
- Std.dev = 14.2259
- 7 items below graph minimum of -20.8756
- 209 items above graph maximum of 84.204
|
2 Instances
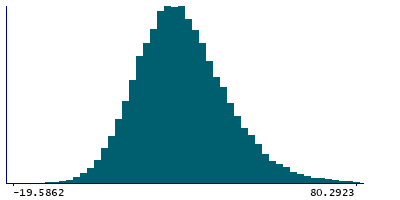
Instance 2 : Imaging visit (2014+)
73,327 participants, 73,327 items
| Maximum | 184.385 |
| Decile 9 | 49.3225 |
| Decile 8 | 41.8813 |
| Decile 7 | 36.9988 |
| Decile 6 | 33.1502 |
| Median | 29.7499 |
| Decile 4 | 26.4456 |
| Decile 3 | 23.1314 |
| Decile 2 | 19.247 |
| Decile 1 | 14.2182 |
| Minimum | -34.0543 |
|
|
- Mean = 30.995
- Std.dev = 14.258
- 7 items below graph minimum of -20.886
- 199 items above graph maximum of 84.4267
|
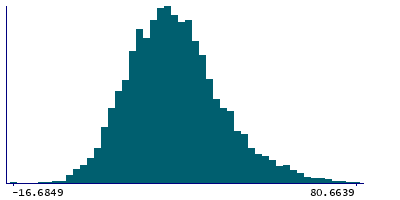
Instance 3 : First repeat imaging visit (2019+)
4,631 participants, 4,631 items
| Maximum | 125.785 |
| Decile 9 | 46.8855 |
| Decile 8 | 39.5014 |
| Decile 7 | 35.0126 |
| Decile 6 | 31.5193 |
| Median | 28.1265 |
| Decile 4 | 25.0354 |
| Decile 3 | 21.6867 |
| Decile 2 | 18.0065 |
| Decile 1 | 13.107 |
| Minimum | -16.6849 |
|
|
- Mean = 29.2819
- Std.dev = 13.6064
- 10 items above graph maximum of 80.6639
|
Notes
Median magnetic susceptibility in left caudate (from QSM processing of SWI data)
0 Related Data-Fields
There are no related data-fields


