Data
90,479 items of data are available, covering 85,381 participants.
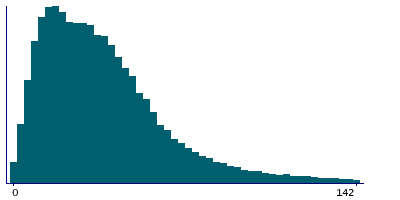
Defined-instances run from 2 to 3, labelled using Instancing
2.
| Maximum | 519 |
| Decile 9 | 73 |
| Decile 8 | 54 |
| Decile 7 | 43 |
| Decile 6 | 36 |
| Median | 29 |
| Decile 4 | 23 |
| Decile 3 | 18 |
| Decile 2 | 14 |
| Decile 1 | 9 |
| Minimum | 0 |
|
|
- There are 352 distinct values.
- Mean = 37.5179
- Std.dev = 33.6265
- 1753 items above graph maximum of 137
|
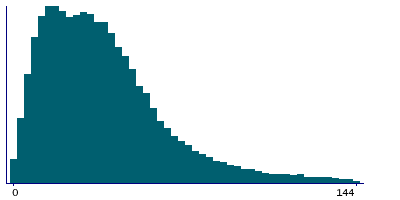
2 Instances
Instance 2 : Imaging visit (2014+)
85,291 participants, 85,291 items
| Maximum | 519 |
| Decile 9 | 74 |
| Decile 8 | 54 |
| Decile 7 | 44 |
| Decile 6 | 37 |
| Median | 30 |
| Decile 4 | 24 |
| Decile 3 | 18 |
| Decile 2 | 14 |
| Decile 1 | 9 |
| Minimum | 0 |
|
|
- There are 350 distinct values.
- Mean = 38.0058
- Std.dev = 33.9837
- 1643 items above graph maximum of 139
|
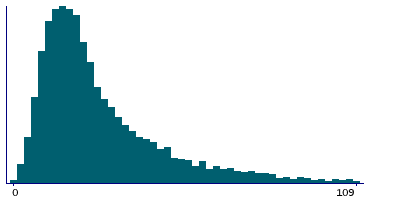
Instance 3 : First repeat imaging visit (2019+)
5,188 participants, 5,188 items
| Maximum | 352 |
| Decile 9 | 59 |
| Decile 8 | 41.5 |
| Decile 7 | 32 |
| Decile 6 | 26 |
| Median | 22 |
| Decile 4 | 19 |
| Decile 3 | 16 |
| Decile 2 | 13 |
| Decile 1 | 9 |
| Minimum | 0 |
|
|
- There are 168 distinct values.
- Mean = 29.4979
- Std.dev = 25.7982
- 93 items above graph maximum of 109
|
Notes
Number of slices that Eddy estimated to be outliers in the dMRI data
0 Related Data-Fields
There are no related data-fields


