Data
75,079 items of data are available, covering 70,785 participants.
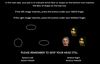
Defined-instances run from 2 to 3, labelled using Instancing
2.
| Maximum | 1.01733 |
| Decile 9 | 0.214946 |
| Decile 8 | 0.178022 |
| Decile 7 | 0.156031 |
| Decile 6 | 0.139442 |
| Median | 0.125674 |
| Decile 4 | 0.113401 |
| Decile 3 | 0.101769 |
| Decile 2 | 0.0899872 |
| Decile 1 | 0.0765018 |
| Minimum | 0.0294609 |
|
|
- Mean = 0.138507
- Std.dev = 0.0615183
- 708 items above graph maximum of 0.353391
|
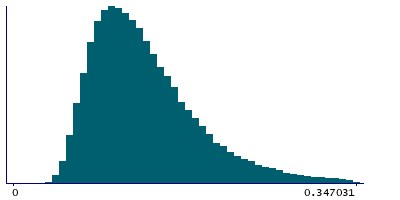
2 Instances
Instance 2 : Imaging visit (2014+)
70,421 participants, 70,421 items
| Maximum | 1.01733 |
| Decile 9 | 0.215881 |
| Decile 8 | 0.1788 |
| Decile 7 | 0.156575 |
| Decile 6 | 0.13998 |
| Median | 0.126154 |
| Decile 4 | 0.11383 |
| Decile 3 | 0.102124 |
| Decile 2 | 0.0902717 |
| Decile 1 | 0.0766404 |
| Minimum | 0.0298511 |
|
|
- Mean = 0.139033
- Std.dev = 0.061879
- 664 items above graph maximum of 0.355122
|
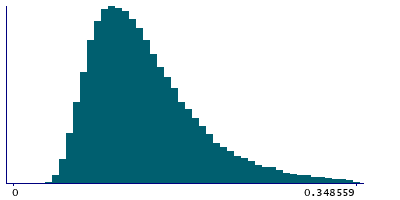
Instance 3 : First repeat imaging visit (2019+)
4,658 participants, 4,658 items
| Maximum | 0.492128 |
| Decile 9 | 0.202048 |
| Decile 8 | 0.165014 |
| Decile 7 | 0.146863 |
| Decile 6 | 0.13124 |
| Median | 0.118841 |
| Decile 4 | 0.107187 |
| Decile 3 | 0.0969022 |
| Decile 2 | 0.0861864 |
| Decile 1 | 0.0741964 |
| Minimum | 0.0294609 |
|
|
- Mean = 0.130549
- Std.dev = 0.0551745
- 30 items above graph maximum of 0.329901
|