Data
75,079 items of data are available, covering 70,785 participants.
Defined-instances run from 2 to 3, labelled using Instancing
2.
| Maximum | 37.9326 |
| Decile 9 | 2.28738 |
| Decile 8 | 1.7708 |
| Decile 7 | 1.45937 |
| Decile 6 | 1.22564 |
| Median | 1.03668 |
| Decile 4 | 0.876 |
| Decile 3 | 0.735089 |
| Decile 2 | 0.600796 |
| Decile 1 | 0.460727 |
| Minimum | 0.102138 |
|
|
- Mean = 1.26406
- Std.dev = 0.929601
- 1040 items above graph maximum of 4.11403
|
2 Instances
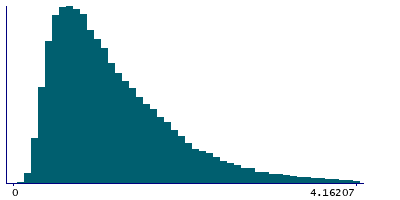
Instance 2 : Imaging visit (2014+)
70,421 participants, 70,421 items
| Maximum | 37.9326 |
| Decile 9 | 2.28801 |
| Decile 8 | 1.77088 |
| Decile 7 | 1.45591 |
| Decile 6 | 1.22337 |
| Median | 1.03284 |
| Decile 4 | 0.871779 |
| Decile 3 | 0.731437 |
| Decile 2 | 0.597401 |
| Decile 1 | 0.457648 |
| Minimum | 0.102138 |
|

|
- Mean = 1.26175
- Std.dev = 0.930887
- 979 items above graph maximum of 4.11837
|
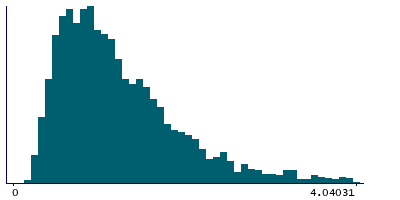
Instance 3 : First repeat imaging visit (2019+)
4,658 participants, 4,658 items
| Maximum | 17.1863 |
| Decile 9 | 2.27252 |
| Decile 8 | 1.77014 |
| Decile 7 | 1.49477 |
| Decile 6 | 1.26 |
| Median | 1.09003 |
| Decile 4 | 0.932642 |
| Decile 3 | 0.797037 |
| Decile 2 | 0.652096 |
| Decile 1 | 0.504568 |
| Minimum | 0.185381 |
|
|
- Mean = 1.29903
- Std.dev = 0.909235
- 61 items above graph maximum of 4.04048
|