Data
507,721 items of data are available, covering 488,283 participants.
Defined-instances run from 0 to 1, labelled using Instancing
2.
Units of measurement are percent.
| Maximum | 99.989 |
| Decile 9 | 9.4256 |
| Decile 8 | 7.30795 |
| Decile 7 | 6.07626 |
| Decile 6 | 5.1702 |
| Median | 4.4442 |
| Decile 4 | 3.8239 |
| Decile 3 | 3.28489 |
| Decile 2 | 2.793 |
| Decile 1 | 2.2994 |
| Minimum | 0.0017145 |
|
|
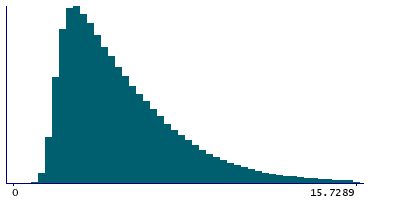
- Mean = 5.46845
- Std.dev = 4.24171
- 8885 items above graph maximum of 16.5518
|
2 Instances
Instance 0 : Initial assessment visit (2006-2010) at which participants were recruited and consent given
487,850 participants, 487,850 items
| Maximum | 99.989 |
| Decile 9 | 9.46261 |
| Decile 8 | 7.3372 |
| Decile 7 | 6.10216 |
| Decile 6 | 5.1909 |
| Median | 4.46142 |
| Decile 4 | 3.8371 |
| Decile 3 | 3.2929 |
| Decile 2 | 2.798 |
| Decile 1 | 2.3014 |
| Minimum | 0.0017145 |
|
|
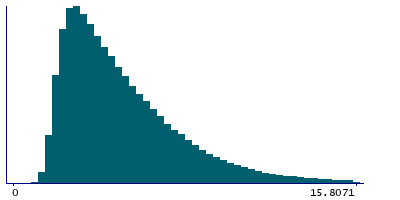
- Mean = 5.48816
- Std.dev = 4.26211
- 8537 items above graph maximum of 16.6238
|
Instance 1 : First repeat assessment visit (2012-13)
19,871 participants, 19,871 items
| Maximum | 99.689 |
| Decile 9 | 8.44845 |
| Decile 8 | 6.57045 |
| Decile 7 | 5.4759 |
| Decile 6 | 4.67125 |
| Median | 4.06085 |
| Decile 4 | 3.5588 |
| Decile 3 | 3.1104 |
| Decile 2 | 2.68615 |
| Decile 1 | 2.25747 |
| Minimum | 0.92762 |
|
|
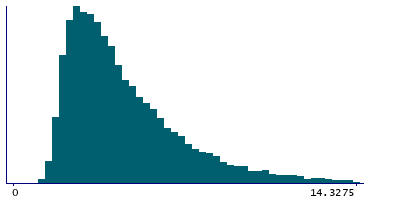
- Mean = 4.98479
- Std.dev = 3.673
- 348 items above graph maximum of 14.6394
|


