Data
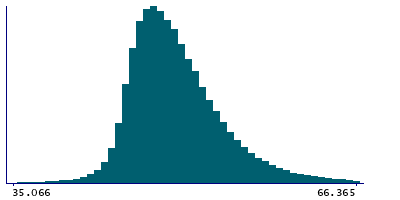
507,721 items of data are available, covering 488,283 participants.
Defined-instances run from 0 to 1, labelled using Instancing
2.
Units of measurement are percent.
| Maximum | 99.983 |
| Decile 9 | 56.3869 |
| Decile 8 | 53.477 |
| Decile 7 | 51.767 |
| Decile 6 | 50.4841 |
| Median | 49.4235 |
| Decile 4 | 48.4701 |
| Decile 3 | 47.57 |
| Decile 2 | 46.6469 |
| Decile 1 | 45.525 |
| Minimum | 0.0058568 |
|
|
- Mean = 50.3921
- Std.dev = 5.27806
- 862 items below graph minimum of 34.6631
- 6949 items above graph maximum of 67.2488
|
2 Instances
Instance 0 : Initial assessment visit (2006-2010) at which participants were recruited and consent given
487,850 participants, 487,850 items
| Maximum | 99.983 |
| Decile 9 | 56.436 |
| Decile 8 | 53.516 |
| Decile 7 | 51.803 |
| Decile 6 | 50.513 |
| Median | 49.4503 |
| Decile 4 | 48.494 |
| Decile 3 | 47.59 |
| Decile 2 | 46.661 |
| Decile 1 | 45.531 |
| Minimum | 0.0058568 |
|

|
- Mean = 50.4187
- Std.dev = 5.29447
- 839 items below graph minimum of 34.626
- 6653 items above graph maximum of 67.341
|
Instance 1 : First repeat assessment visit (2012-13)
19,871 participants, 19,871 items
| Maximum | 97.227 |
| Decile 9 | 55.1557 |
| Decile 8 | 52.458 |
| Decile 7 | 50.901 |
| Decile 6 | 49.7532 |
| Median | 48.813 |
| Decile 4 | 47.937 |
| Decile 3 | 47.156 |
| Decile 2 | 46.3545 |
| Decile 1 | 45.3985 |
| Minimum | 0.23774 |
|

|
- Mean = 49.7386
- Std.dev = 4.81184
- 25 items below graph minimum of 35.6413
- 282 items above graph maximum of 64.9128
|


