Data
507,960 items of data are available, covering 488,512 participants.
Defined-instances run from 0 to 1, labelled using Instancing
2.
Units of measurement are percent.
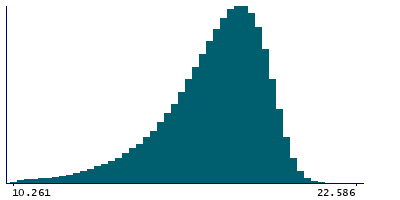
| Maximum | 22.586 |
| Decile 9 | 19.422 |
| Decile 8 | 18.9467 |
| Decile 7 | 18.5483 |
| Decile 6 | 18.1652 |
| Median | 17.765 |
| Decile 4 | 17.316 |
| Decile 3 | 16.7773 |
| Decile 2 | 16.0572 |
| Decile 1 | 14.8504 |
| Minimum | 3.44641e-11 |
|
|
- Mean = 17.3665
- Std.dev = 2.01288
- 4360 items below graph minimum of 10.2788
|
2 Instances
Instance 0 : Initial assessment visit (2006-2010) at which participants were recruited and consent given
488,083 participants, 488,083 items
| Maximum | 22.586 |
| Decile 9 | 19.428 |
| Decile 8 | 18.9525 |
| Decile 7 | 18.553 |
| Decile 6 | 18.169 |
| Median | 17.768 |
| Decile 4 | 17.317 |
| Decile 3 | 16.777 |
| Decile 2 | 16.055 |
| Decile 1 | 14.842 |
| Minimum | 3.44641e-11 |
|

|
- Mean = 17.3671
- Std.dev = 2.01965
- 4198 items below graph minimum of 10.256
|
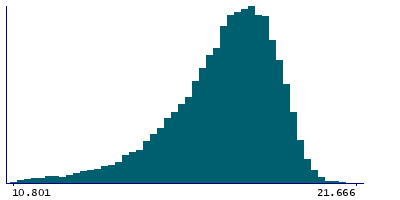
Instance 1 : First repeat assessment visit (2012-13)
19,877 participants, 19,877 items
| Maximum | 21.666 |
| Decile 9 | 19.2715 |
| Decile 8 | 18.805 |
| Decile 7 | 18.432 |
| Decile 6 | 18.07 |
| Median | 17.696 |
| Decile 4 | 17.298 |
| Decile 3 | 16.7925 |
| Decile 2 | 16.112 |
| Decile 1 | 15.052 |
| Minimum | 0.36728 |
|
|
- Mean = 17.3533
- Std.dev = 1.83884
- 146 items below graph minimum of 10.8325
|


