Data
507,960 items of data are available, covering 488,512 participants.
Defined-instances run from 0 to 1, labelled using Instancing
2.
Units of measurement are percent.
| Maximum | 67.3556 |
| Decile 9 | 48.3732 |
| Decile 8 | 47.522 |
| Decile 7 | 46.9182 |
| Decile 6 | 46.4 |
| Median | 45.912 |
| Decile 4 | 45.4155 |
| Decile 3 | 44.8756 |
| Decile 2 | 44.236 |
| Decile 1 | 43.3032 |
| Minimum | 3.9674e-11 |
|
|
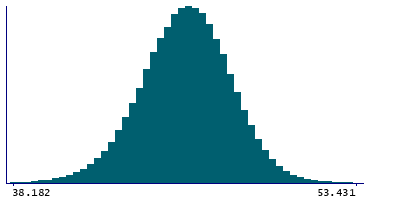
- Mean = 45.8748
- Std.dev = 2.08919
- 534 items below graph minimum of 38.2332
- 989 items above graph maximum of 53.4433
|
2 Instances
Instance 0 : Initial assessment visit (2006-2010) at which participants were recruited and consent given
488,083 participants, 488,083 items
| Maximum | 67.3556 |
| Decile 9 | 48.378 |
| Decile 8 | 47.527 |
| Decile 7 | 46.9227 |
| Decile 6 | 46.404 |
| Median | 45.915 |
| Decile 4 | 45.4184 |
| Decile 3 | 44.8791 |
| Decile 2 | 44.24 |
| Decile 1 | 43.309 |
| Minimum | 3.9674e-11 |
|

|
- Mean = 45.8793
- Std.dev = 2.0898
- 510 items below graph minimum of 38.24
- 958 items above graph maximum of 53.447
|
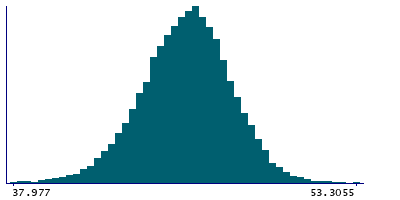
Instance 1 : First repeat assessment visit (2012-13)
19,877 participants, 19,877 items
| Maximum | 60.988 |
| Decile 9 | 48.253 |
| Decile 8 | 47.4194 |
| Decile 7 | 46.8245 |
| Decile 6 | 46.3084 |
| Median | 45.8335 |
| Decile 4 | 45.337 |
| Decile 3 | 44.7885 |
| Decile 2 | 44.1431 |
| Decile 1 | 43.173 |
| Minimum | 34.92 |
|
|
- Mean = 45.7663
- Std.dev = 2.0714
- 21 items below graph minimum of 38.093
- 32 items above graph maximum of 53.333
|


