Data
507,960 items of data are available, covering 488,512 participants.
Defined-instances run from 0 to 1, labelled using Instancing
2.
Units of measurement are percent.
| Maximum | 59.3341 |
| Decile 9 | 51.46 |
| Decile 8 | 50.709 |
| Decile 7 | 50.172 |
| Decile 6 | 49.7061 |
| Median | 49.254 |
| Decile 4 | 48.778 |
| Decile 3 | 48.243 |
| Decile 2 | 47.588 |
| Decile 1 | 46.643 |
| Minimum | 0 |
|
|
- Mean = 49.1294
- Std.dev = 1.99897
- 1131 items below graph minimum of 41.826
- 83 items above graph maximum of 56.277
|
2 Instances
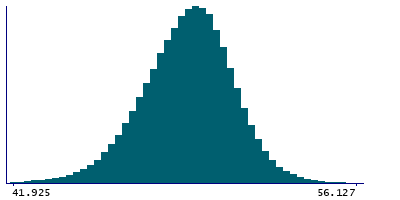
Instance 0 : Initial assessment visit (2006-2010) at which participants were recruited and consent given
488,083 participants, 488,083 items
| Maximum | 59.3341 |
| Decile 9 | 51.457 |
| Decile 8 | 50.7051 |
| Decile 7 | 50.1674 |
| Decile 6 | 49.701 |
| Median | 49.2483 |
| Decile 4 | 48.773 |
| Decile 3 | 48.2385 |
| Decile 2 | 47.583 |
| Decile 1 | 46.6383 |
| Minimum | 0 |
|

|
- Mean = 49.1248
- Std.dev = 2.00098
- 1082 items below graph minimum of 41.8196
- 79 items above graph maximum of 56.2757
|
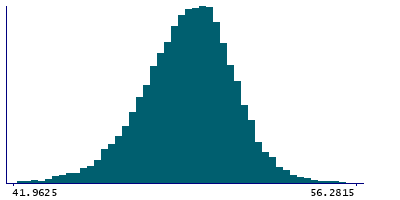
Instance 1 : First repeat assessment visit (2012-13)
19,877 participants, 19,877 items
| Maximum | 57.619 |
| Decile 9 | 51.5355 |
| Decile 8 | 50.807 |
| Decile 7 | 50.2827 |
| Decile 6 | 49.833 |
| Median | 49.3775 |
| Decile 4 | 48.904 |
| Decile 3 | 48.369 |
| Decile 2 | 47.73 |
| Decile 1 | 46.773 |
| Minimum | 38.327 |
|
|
- Mean = 49.2424
- Std.dev = 1.94552
- 48 items below graph minimum of 42.0105
- 4 items above graph maximum of 56.298
|


