Data
507,960 items of data are available, covering 488,512 participants.
Defined-instances run from 0 to 1, labelled using Instancing
2.
Units of measurement are percent.
| Maximum | 59.6938 |
| Decile 9 | 27.184 |
| Decile 8 | 26.8552 |
| Decile 7 | 26.606 |
| Decile 6 | 26.3882 |
| Median | 26.183 |
| Decile 4 | 25.976 |
| Decile 3 | 25.75 |
| Decile 2 | 25.479 |
| Decile 1 | 25.0838 |
| Minimum | 19.0934 |
|
|
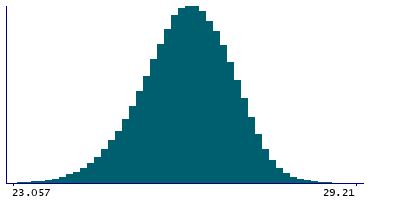
- Mean = 26.1548
- Std.dev = 0.843601
- 289 items below graph minimum of 22.9837
- 208 items above graph maximum of 29.2842
|
2 Instances
Instance 0 : Initial assessment visit (2006-2010) at which participants were recruited and consent given
488,083 participants, 488,083 items
| Maximum | 59.6938 |
| Decile 9 | 27.188 |
| Decile 8 | 26.86 |
| Decile 7 | 26.6105 |
| Decile 6 | 26.393 |
| Median | 26.187 |
| Decile 4 | 25.98 |
| Decile 3 | 25.754 |
| Decile 2 | 25.483 |
| Decile 1 | 25.088 |
| Minimum | 19.0934 |
|

|
- Mean = 26.159
- Std.dev = 0.844448
- 282 items below graph minimum of 22.988
- 203 items above graph maximum of 29.288
|
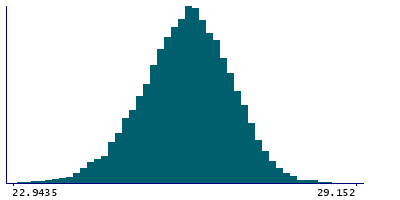
Instance 1 : First repeat assessment visit (2012-13)
19,877 participants, 19,877 items
| Maximum | 32.424 |
| Decile 9 | 27.064 |
| Decile 8 | 26.734 |
| Decile 7 | 26.495 |
| Decile 6 | 26.278 |
| Median | 26.085 |
| Decile 4 | 25.878 |
| Decile 3 | 25.653 |
| Decile 2 | 25.3855 |
| Decile 1 | 25.001 |
| Minimum | 22.471 |
|
|
- Mean = 26.052
- Std.dev = 0.815826
- 8 items below graph minimum of 22.938
- 6 items above graph maximum of 29.127
|


