Data
507,960 items of data are available, covering 488,512 participants.
Defined-instances run from 0 to 1, labelled using Instancing
2.
Units of measurement are percent.
| Maximum | 72.9933 |
| Decile 9 | 8.37632 |
| Decile 8 | 7.3719 |
| Decile 7 | 6.7874 |
| Decile 6 | 6.3552 |
| Median | 5.9973 |
| Decile 4 | 5.674 |
| Decile 3 | 5.3614 |
| Decile 2 | 5.0313 |
| Decile 1 | 4.6229 |
| Minimum | 2.0951 |
|

|
- Mean = 6.34114
- Std.dev = 1.83999
- 5721 items above graph maximum of 12.1297
|
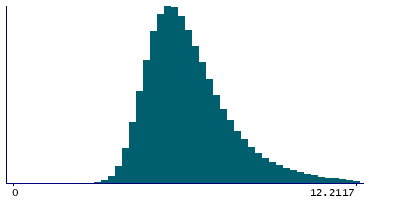
2 Instances
Instance 0 : Initial assessment visit (2006-2010) at which participants were recruited and consent given
488,083 participants, 488,083 items
| Maximum | 72.9933 |
| Decile 9 | 8.37749 |
| Decile 8 | 7.37015 |
| Decile 7 | 6.78542 |
| Decile 6 | 6.35202 |
| Median | 5.99388 |
| Decile 4 | 5.6708 |
| Decile 3 | 5.3583 |
| Decile 2 | 5.0286 |
| Decile 1 | 4.61922 |
| Minimum | 2.0951 |
|
|
- Mean = 6.33979
- Std.dev = 1.84631
- 5539 items above graph maximum of 12.1358
|
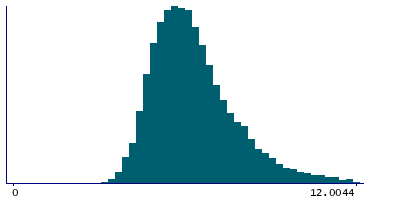
Instance 1 : First repeat assessment visit (2012-13)
19,877 participants, 19,877 items
| Maximum | 43.43 |
| Decile 9 | 8.3488 |
| Decile 8 | 7.40505 |
| Decile 7 | 6.83831 |
| Decile 6 | 6.42355 |
| Median | 6.0764 |
| Decile 4 | 5.75532 |
| Decile 3 | 5.43935 |
| Decile 2 | 5.1058 |
| Decile 1 | 4.70247 |
| Minimum | 2.70327 |
|
|
- Mean = 6.37426
- Std.dev = 1.6768
- 177 items above graph maximum of 11.9951
|


