Data
507,960 items of data are available, covering 488,512 participants.
Defined-instances run from 0 to 1, labelled using Instancing
2.
Units of measurement are percent.
| Maximum | 57.992 |
| Decile 9 | 54.155 |
| Decile 8 | 53.743 |
| Decile 7 | 53.425 |
| Decile 6 | 53.132 |
| Median | 52.8449 |
| Decile 4 | 52.5419 |
| Decile 3 | 52.2035 |
| Decile 2 | 51.793 |
| Decile 1 | 51.1945 |
| Minimum | 0 |
|

|
- Mean = 52.7253
- Std.dev = 1.35329
- 1580 items below graph minimum of 48.2341
- 5 items above graph maximum of 57.1155
|
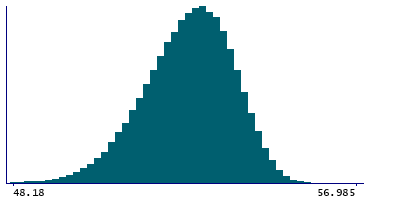
2 Instances
Instance 0 : Initial assessment visit (2006-2010) at which participants were recruited and consent given
488,083 participants, 488,083 items
| Maximum | 57.992 |
| Decile 9 | 54.155 |
| Decile 8 | 53.744 |
| Decile 7 | 53.4262 |
| Decile 6 | 53.134 |
| Median | 52.8468 |
| Decile 4 | 52.5439 |
| Decile 3 | 52.206 |
| Decile 2 | 51.795 |
| Decile 1 | 51.197 |
| Minimum | 0 |
|
|
- Mean = 52.7268
- Std.dev = 1.35541
- 1528 items below graph minimum of 48.239
- 5 items above graph maximum of 57.113
|
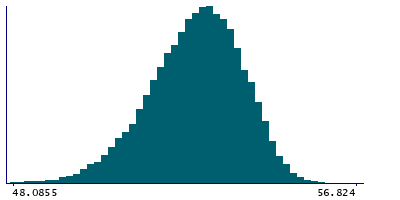
Instance 1 : First repeat assessment visit (2012-13)
19,877 participants, 19,877 items
| Maximum | 56.824 |
| Decile 9 | 54.1562 |
| Decile 8 | 53.714 |
| Decile 7 | 53.3893 |
| Decile 6 | 53.09 |
| Median | 52.801 |
| Decile 4 | 52.4915 |
| Decile 3 | 52.14 |
| Decile 2 | 51.7382 |
| Decile 1 | 51.1295 |
| Minimum | 14.948 |
|
|
- Mean = 52.6879
- Std.dev = 1.2996
- 51 items below graph minimum of 48.1028
|


