Data
507,960 items of data are available, covering 488,512 participants.
Defined-instances run from 0 to 1, labelled using Instancing
2.
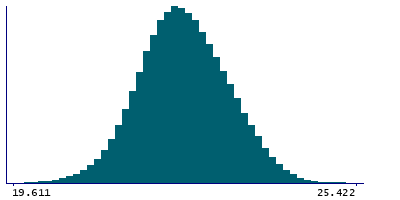
Units of measurement are percent.
| Maximum | 57.2875 |
| Decile 9 | 23.432 |
| Decile 8 | 23.084 |
| Decile 7 | 22.831 |
| Decile 6 | 22.619 |
| Median | 22.4249 |
| Decile 4 | 22.238 |
| Decile 3 | 22.043 |
| Decile 2 | 21.8194 |
| Decile 1 | 21.506 |
| Minimum | 18.2955 |
|

|
- Mean = 22.4487
- Std.dev = 0.799496
- 209 items below graph minimum of 19.58
- 423 items above graph maximum of 25.358
|
2 Instances
Instance 0 : Initial assessment visit (2006-2010) at which participants were recruited and consent given
488,083 participants, 488,083 items
| Maximum | 57.2875 |
| Decile 9 | 23.432 |
| Decile 8 | 23.0847 |
| Decile 7 | 22.831 |
| Decile 6 | 22.619 |
| Median | 22.425 |
| Decile 4 | 22.2385 |
| Decile 3 | 22.044 |
| Decile 2 | 21.82 |
| Decile 1 | 21.5067 |
| Minimum | 18.2955 |
|
|
- Mean = 22.4491
- Std.dev = 0.800047
- 205 items below graph minimum of 19.5813
- 407 items above graph maximum of 25.3573
|
Instance 1 : First repeat assessment visit (2012-13)
19,877 participants, 19,877 items
| Maximum | 40.941 |
| Decile 9 | 23.425 |
| Decile 8 | 23.0765 |
| Decile 7 | 22.8231 |
| Decile 6 | 22.611 |
| Median | 22.418 |
| Decile 4 | 22.223 |
| Decile 3 | 22.027 |
| Decile 2 | 21.803 |
| Decile 1 | 21.4926 |
| Minimum | 19.202 |
|

|
- Mean = 22.4405
- Std.dev = 0.785812
- 5 items below graph minimum of 19.5602
- 16 items above graph maximum of 25.3574
|


