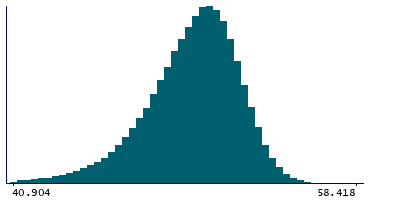
Data
507,960 items of data are available, covering 488,512 participants.
Defined-instances run from 0 to 1, labelled using Instancing
2.
Units of measurement are percent.
| Maximum | 58.418 |
| Decile 9 | 52.762 |
| Decile 8 | 52.0074 |
| Decile 7 | 51.433 |
| Decile 6 | 50.904 |
| Median | 50.3775 |
| Decile 4 | 49.7991 |
| Decile 3 | 49.13 |
| Decile 2 | 48.271 |
| Decile 1 | 46.924 |
| Minimum | 20.651 |
|
|
- Mean = 50.0412
- Std.dev = 2.42277
- 2326 items below graph minimum of 41.086
|
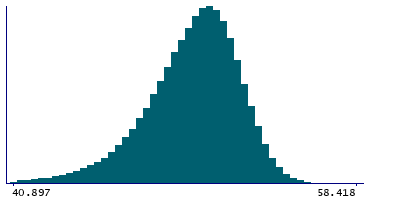
2 Instances
Instance 0 : Initial assessment visit (2006-2010) at which participants were recruited and consent given
488,083 participants, 488,083 items
| Maximum | 58.418 |
| Decile 9 | 52.771 |
| Decile 8 | 52.018 |
| Decile 7 | 51.4449 |
| Decile 6 | 50.9165 |
| Median | 50.39 |
| Decile 4 | 49.812 |
| Decile 3 | 49.142 |
| Decile 2 | 48.281 |
| Decile 1 | 46.93 |
| Minimum | 20.651 |
|
|
- Mean = 50.0512
- Std.dev = 2.4245
- 2244 items below graph minimum of 41.089
|
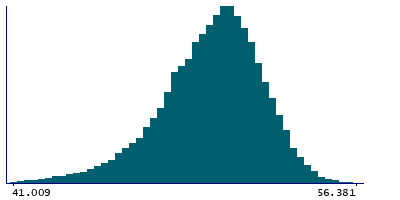
Instance 1 : First repeat assessment visit (2012-13)
19,877 participants, 19,877 items
| Maximum | 56.381 |
| Decile 9 | 52.528 |
| Decile 8 | 51.7185 |
| Decile 7 | 51.121 |
| Decile 6 | 50.5945 |
| Median | 50.082 |
| Decile 4 | 49.5153 |
| Decile 3 | 48.865 |
| Decile 2 | 48.0495 |
| Decile 1 | 46.7542 |
| Minimum | 32.537 |
|
|
- Mean = 49.7957
- Std.dev = 2.36668
- 77 items below graph minimum of 40.9805
|


