Data
507,960 items of data are available, covering 488,512 participants.
Defined-instances run from 0 to 1, labelled using Instancing
2.
Units of measurement are percent.
| Maximum | 74.7335 |
| Decile 9 | 70.8911 |
| Decile 8 | 70.1668 |
| Decile 7 | 69.5409 |
| Decile 6 | 68.931 |
| Median | 68.283 |
| Decile 4 | 67.571 |
| Decile 3 | 66.7336 |
| Decile 2 | 65.6516 |
| Decile 1 | 63.903 |
| Minimum | 40.3779 |
|
|
- Mean = 67.729
- Std.dev = 2.96875
- 3503 items below graph minimum of 56.915
|
2 Instances
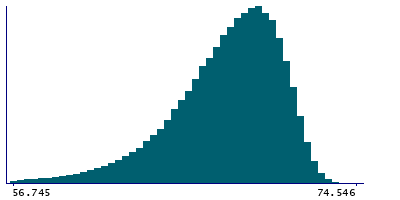
Instance 0 : Initial assessment visit (2006-2010) at which participants were recruited and consent given
488,083 participants, 488,083 items
| Maximum | 74.7335 |
| Decile 9 | 70.896 |
| Decile 8 | 70.1722 |
| Decile 7 | 69.548 |
| Decile 6 | 68.9394 |
| Median | 68.291 |
| Decile 4 | 67.579 |
| Decile 3 | 66.739 |
| Decile 2 | 65.657 |
| Decile 1 | 63.903 |
| Minimum | 40.3779 |
|

|
- Mean = 67.7337
- Std.dev = 2.97228
- 3389 items below graph minimum of 56.91
|
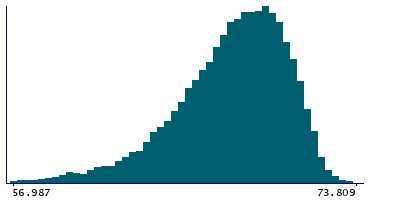
Instance 1 : First repeat assessment visit (2012-13)
19,877 participants, 19,877 items
| Maximum | 73.809 |
| Decile 9 | 70.776 |
| Decile 8 | 70.0033 |
| Decile 7 | 69.365 |
| Decile 6 | 68.734 |
| Median | 68.087 |
| Decile 4 | 67.406 |
| Decile 3 | 66.5935 |
| Decile 2 | 65.536 |
| Decile 1 | 63.9073 |
| Minimum | 47.46 |
|
|
- Mean = 67.6125
- Std.dev = 2.87821
- 113 items below graph minimum of 57.0386
|


