Data
507,960 items of data are available, covering 488,512 participants.
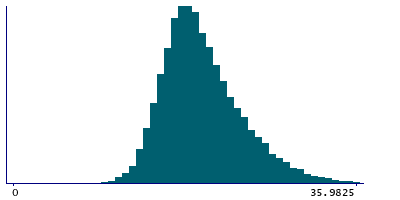
Defined-instances run from 0 to 1, labelled using Instancing
2.
Units of measurement are percent.
| Maximum | 54.8729 |
| Decile 9 | 25.377 |
| Decile 8 | 22.851 |
| Decile 7 | 21.2672 |
| Decile 6 | 20.0735 |
| Median | 19.066 |
| Decile 4 | 18.161 |
| Decile 3 | 17.267 |
| Decile 2 | 16.284 |
| Decile 1 | 14.9973 |
| Minimum | 3.6654 |
|

|
- Mean = 19.7251
- Std.dev = 4.26417
- 1769 items above graph maximum of 35.7567
|
2 Instances
Instance 0 : Initial assessment visit (2006-2010) at which participants were recruited and consent given
488,083 participants, 488,083 items
| Maximum | 54.8729 |
| Decile 9 | 25.3694 |
| Decile 8 | 22.8414 |
| Decile 7 | 21.26 |
| Decile 6 | 20.067 |
| Median | 19.061 |
| Decile 4 | 18.1579 |
| Decile 3 | 17.2627 |
| Decile 2 | 16.278 |
| Decile 1 | 14.9926 |
| Minimum | 3.6654 |
|

|
- Mean = 19.7199
- Std.dev = 4.26529
- 1712 items above graph maximum of 35.7463
|
Instance 1 : First repeat assessment visit (2012-13)
19,877 participants, 19,877 items
| Maximum | 47.341 |
| Decile 9 | 25.5655 |
| Decile 8 | 23.0755 |
| Decile 7 | 21.4345 |
| Decile 6 | 20.224 |
| Median | 19.173 |
| Decile 4 | 18.2545 |
| Decile 3 | 17.384 |
| Decile 2 | 16.4189 |
| Decile 1 | 15.1161 |
| Minimum | 6.30094 |
|
|
- Mean = 19.8523
- Std.dev = 4.23452
- 57 items above graph maximum of 36.0149
|


