Data
507,960 items of data are available, covering 488,512 participants.
Defined-instances run from 0 to 1, labelled using Instancing
2.
Units of measurement are percent.
| Maximum | 20.348 |
| Decile 9 | 16.674 |
| Decile 8 | 16.507 |
| Decile 7 | 16.374 |
| Decile 6 | 16.2479 |
| Median | 16.119 |
| Decile 4 | 15.978 |
| Decile 3 | 15.8127 |
| Decile 2 | 15.596 |
| Decile 1 | 15.234 |
| Minimum | 9.66432 |
|
|
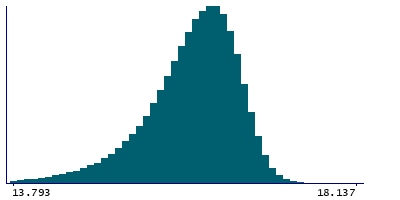
- Mean = 16.0161
- Std.dev = 0.61459
- 3362 items below graph minimum of 13.794
- 16 items above graph maximum of 18.114
|
2 Instances
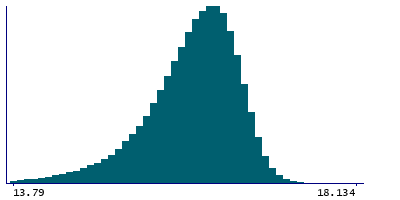
Instance 0 : Initial assessment visit (2006-2010) at which participants were recruited and consent given
488,083 participants, 488,083 items
| Maximum | 20.348 |
| Decile 9 | 16.671 |
| Decile 8 | 16.5043 |
| Decile 7 | 16.371 |
| Decile 6 | 16.245 |
| Median | 16.1166 |
| Decile 4 | 15.976 |
| Decile 3 | 15.8106 |
| Decile 2 | 15.594 |
| Decile 1 | 15.232 |
| Minimum | 9.66432 |
|
|
- Mean = 16.0136
- Std.dev = 0.614609
- 3249 items below graph minimum of 13.793
- 16 items above graph maximum of 18.11
|
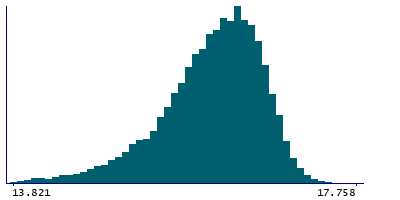
Instance 1 : First repeat assessment visit (2012-13)
19,877 participants, 19,877 items
| Maximum | 17.758 |
| Decile 9 | 16.739 |
| Decile 8 | 16.5753 |
| Decile 7 | 16.439 |
| Decile 6 | 16.314 |
| Median | 16.18 |
| Decile 4 | 16.034 |
| Decile 3 | 15.866 |
| Decile 2 | 15.653 |
| Decile 1 | 15.283 |
| Minimum | 11.8964 |
|
|
- Mean = 16.0781
- Std.dev = 0.610843
- 110 items below graph minimum of 13.827
|


