Data
507,960 items of data are available, covering 488,512 participants.
Defined-instances run from 0 to 1, labelled using Instancing
2.
Units of measurement are percent.
| Maximum | 67.823 |
| Decile 9 | 43.7038 |
| Decile 8 | 41.871 |
| Decile 7 | 40.493 |
| Decile 6 | 39.2696 |
| Median | 38.0903 |
| Decile 4 | 36.8722 |
| Decile 3 | 35.5216 |
| Decile 2 | 33.8707 |
| Decile 1 | 31.51 |
| Minimum | 7.3397 |
|

|
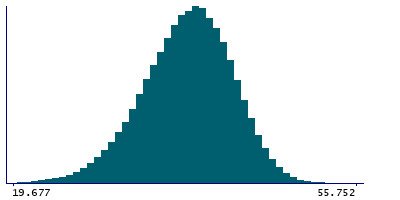
- Mean = 37.8065
- Std.dev = 4.78501
- 200 items below graph minimum of 19.3162
- 13 items above graph maximum of 55.8977
|
2 Instances
Instance 0 : Initial assessment visit (2006-2010) at which participants were recruited and consent given
488,083 participants, 488,083 items
| Maximum | 67.823 |
| Decile 9 | 43.7155 |
| Decile 8 | 41.885 |
| Decile 7 | 40.5078 |
| Decile 6 | 39.283 |
| Median | 38.106 |
| Decile 4 | 36.8906 |
| Decile 3 | 35.541 |
| Decile 2 | 33.8894 |
| Decile 1 | 31.5251 |
| Minimum | 7.3397 |
|
|
- Mean = 37.8214
- Std.dev = 4.78428
- 196 items below graph minimum of 19.3347
- 13 items above graph maximum of 55.9059
|
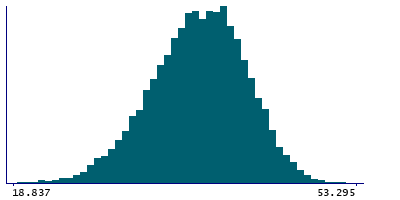
Instance 1 : First repeat assessment visit (2012-13)
19,877 participants, 19,877 items
| Maximum | 53.364 |
| Decile 9 | 43.4018 |
| Decile 8 | 41.517 |
| Decile 7 | 40.1616 |
| Decile 6 | 38.9189 |
| Median | 37.6735 |
| Decile 4 | 36.4478 |
| Decile 3 | 35.0797 |
| Decile 2 | 33.4493 |
| Decile 1 | 31.1195 |
| Minimum | 15.466 |
|
|
- Mean = 37.4402
- Std.dev = 4.78843
- 2 items below graph minimum of 18.8372
|


