Data
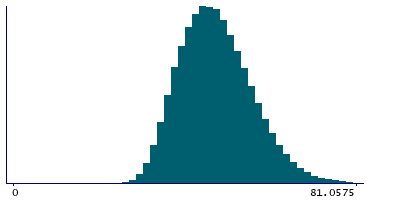
507,960 items of data are available, covering 488,512 participants.
Defined-instances run from 0 to 1, labelled using Instancing
2.
Units of measurement are percent.
| Maximum | 99.397 |
| Decile 9 | 59.2986 |
| Decile 8 | 55.017 |
| Decile 7 | 52.018 |
| Decile 6 | 49.5161 |
| Median | 47.2713 |
| Decile 4 | 45.054 |
| Decile 3 | 42.808 |
| Decile 2 | 40.3231 |
| Decile 1 | 37.249 |
| Minimum | 0.00015781 |
|
|
- Mean = 47.8737
- Std.dev = 8.59315
- 178 items above graph maximum of 81.3481
|
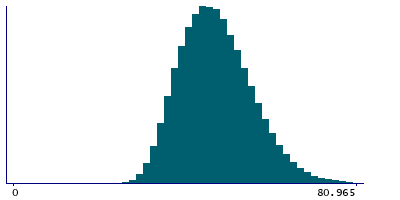
2 Instances
Instance 0 : Initial assessment visit (2006-2010) at which participants were recruited and consent given
488,083 participants, 488,083 items
| Maximum | 99.397 |
| Decile 9 | 59.278 |
| Decile 8 | 54.9974 |
| Decile 7 | 52.0026 |
| Decile 6 | 49.507 |
| Median | 47.2683 |
| Decile 4 | 45.053 |
| Decile 3 | 42.809 |
| Decile 2 | 40.3266 |
| Decile 1 | 37.2549 |
| Minimum | 0.00015781 |
|
|
- Mean = 47.867
- Std.dev = 8.58436
- 170 items above graph maximum of 81.3011
|
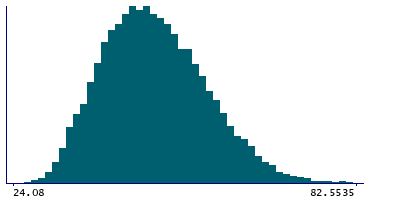
Instance 1 : First repeat assessment visit (2012-13)
19,877 participants, 19,877 items
| Maximum | 87.509 |
| Decile 9 | 59.7625 |
| Decile 8 | 55.4425 |
| Decile 7 | 52.4007 |
| Decile 6 | 49.7685 |
| Median | 47.3505 |
| Decile 4 | 45.071 |
| Decile 3 | 42.791 |
| Decile 2 | 40.2495 |
| Decile 1 | 37.13 |
| Minimum | 21.9654 |
|
|
- Mean = 48.0387
- Std.dev = 8.8048
- 8 items above graph maximum of 82.395
|


