Data
507,901 items of data are available, covering 488,456 participants.
Defined-instances run from 0 to 1, labelled using Instancing
2.
Units of measurement are percent.
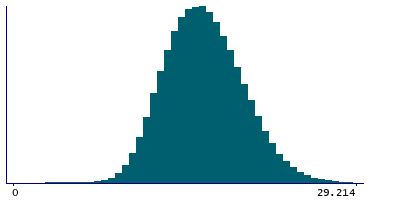
| Maximum | 86.0785 |
| Decile 9 | 20.8277 |
| Decile 8 | 19.1457 |
| Decile 7 | 17.964 |
| Decile 6 | 16.967 |
| Median | 16.061 |
| Decile 4 | 15.177 |
| Decile 3 | 14.276 |
| Decile 2 | 13.287 |
| Decile 1 | 12.012 |
| Minimum | 0.0482171 |
|

|
- Mean = 16.2861
- Std.dev = 3.57639
- 1003 items above graph maximum of 29.6434
|
2 Instances
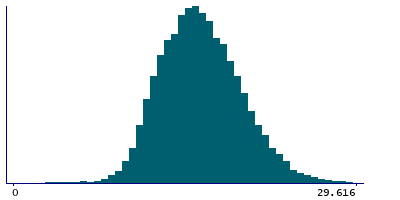
Instance 0 : Initial assessment visit (2006-2010) at which participants were recruited and consent given
488,026 participants, 488,026 items
| Maximum | 86.0785 |
| Decile 9 | 20.8235 |
| Decile 8 | 19.1435 |
| Decile 7 | 17.9631 |
| Decile 6 | 16.968 |
| Median | 16.062 |
| Decile 4 | 15.178 |
| Decile 3 | 14.277 |
| Decile 2 | 13.291 |
| Decile 1 | 12.015 |
| Minimum | 0.0482171 |
|
|
- Mean = 16.2865
- Std.dev = 3.57614
- 974 items above graph maximum of 29.632
|
Instance 1 : First repeat assessment visit (2012-13)
19,875 participants, 19,875 items
| Maximum | 45.744 |
| Decile 9 | 20.9232 |
| Decile 8 | 19.195 |
| Decile 7 | 17.9929 |
| Decile 6 | 16.946 |
| Median | 16.04 |
| Decile 4 | 15.152 |
| Decile 3 | 14.248 |
| Decile 2 | 13.2 |
| Decile 1 | 11.9302 |
| Minimum | 1.9136 |
|
|
- Mean = 16.2761
- Std.dev = 3.58232
- 27 items above graph maximum of 29.9162
|


