Data
507,901 items of data are available, covering 488,456 participants.
Defined-instances run from 0 to 1, labelled using Instancing
2.
Units of measurement are percent.
| Maximum | 99.8836 |
| Decile 9 | 35.78 |
| Decile 8 | 33.681 |
| Decile 7 | 32.229 |
| Decile 6 | 31.027 |
| Median | 29.929 |
| Decile 4 | 28.8682 |
| Decile 3 | 27.785 |
| Decile 2 | 26.589 |
| Decile 1 | 25.03 |
| Minimum | 0.128158 |
|

|
- Mean = 30.1943
- Std.dev = 4.52306
- 1357 items below graph minimum of 14.28
- 1295 items above graph maximum of 46.53
|
2 Instances
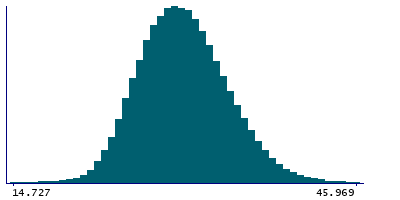
Instance 0 : Initial assessment visit (2006-2010) at which participants were recruited and consent given
488,026 participants, 488,026 items
| Maximum | 99.8836 |
| Decile 9 | 35.7795 |
| Decile 8 | 33.6822 |
| Decile 7 | 32.2299 |
| Decile 6 | 31.031 |
| Median | 29.933 |
| Decile 4 | 28.8729 |
| Decile 3 | 27.79 |
| Decile 2 | 26.597 |
| Decile 1 | 25.0351 |
| Minimum | 0.128158 |
|
|
- Mean = 30.1981
- Std.dev = 4.5227
- 1313 items below graph minimum of 14.2906
- 1249 items above graph maximum of 46.524
|
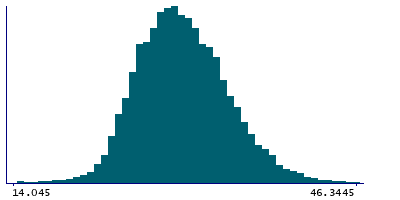
Instance 1 : First repeat assessment visit (2012-13)
19,875 participants, 19,875 items
| Maximum | 73.565 |
| Decile 9 | 35.7845 |
| Decile 8 | 33.652 |
| Decile 7 | 32.2135 |
| Decile 6 | 30.945 |
| Median | 29.8055 |
| Decile 4 | 28.735 |
| Decile 3 | 27.6495 |
| Decile 2 | 26.38 |
| Decile 1 | 24.865 |
| Minimum | 6.3363 |
|
|
- Mean = 30.1004
- Std.dev = 4.53082
- 46 items below graph minimum of 13.9455
- 44 items above graph maximum of 46.704
|


