Data
503,466 items of data are available, covering 484,319 participants.
Defined-instances run from 0 to 1, labelled using Instancing
2.
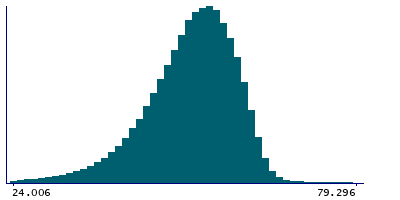
Units of measurement are percent.
| Maximum | 99.2854 |
| Decile 9 | 60.967 |
| Decile 8 | 58.732 |
| Decile 7 | 56.893 |
| Decile 6 | 55.1866 |
| Median | 53.453 |
| Decile 4 | 51.5849 |
| Decile 3 | 49.399 |
| Decile 2 | 46.559 |
| Decile 1 | 41.974 |
| Minimum | 0.0001836 |
|
|
- Mean = 52.1903
- Std.dev = 8.44918
- 4354 items below graph minimum of 22.981
- 1000 items above graph maximum of 79.96
|
2 Instances
Instance 0 : Initial assessment visit (2006-2010) at which participants were recruited and consent given
483,759 participants, 483,759 items
| Maximum | 99.2854 |
| Decile 9 | 60.95 |
| Decile 8 | 58.7165 |
| Decile 7 | 56.879 |
| Decile 6 | 55.173 |
| Median | 53.439 |
| Decile 4 | 51.571 |
| Decile 3 | 49.39 |
| Decile 2 | 46.546 |
| Decile 1 | 41.9596 |
| Minimum | 0.0001836 |
|

|
- Mean = 52.1758
- Std.dev = 8.45296
- 4200 items below graph minimum of 22.9691
- 970 items above graph maximum of 79.9404
|
Instance 1 : First repeat assessment visit (2012-13)
19,707 participants, 19,707 items
| Maximum | 96.507 |
| Decile 9 | 61.3215 |
| Decile 8 | 59.0935 |
| Decile 7 | 57.2015 |
| Decile 6 | 55.519 |
| Median | 53.7755 |
| Decile 4 | 51.9045 |
| Decile 3 | 49.6925 |
| Decile 2 | 46.9414 |
| Decile 1 | 42.329 |
| Minimum | 0.001048 |
|

|
- Mean = 52.5454
- Std.dev = 8.34795
- 149 items below graph minimum of 23.3365
- 33 items above graph maximum of 80.314
|


