Data
486,620 items of data are available, covering 468,668 participants.
Defined-instances run from 0 to 1, labelled using Instancing
2.
Units of measurement are percent.
| Maximum | 60.1196 |
| Decile 9 | 18.113 |
| Decile 8 | 14.7176 |
| Decile 7 | 13.2199 |
| Decile 6 | 12.2929 |
| Median | 11.633 |
| Decile 4 | 11.114 |
| Decile 3 | 10.657 |
| Decile 2 | 10.176 |
| Decile 1 | 9.5153 |
| Minimum | 0.312706 |
|

|
- Mean = 13.022
- Std.dev = 4.7939
- 13803 items above graph maximum of 26.7107
|
2 Instances
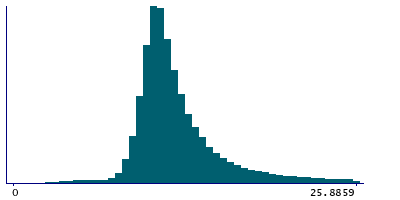
Instance 0 : Initial assessment visit (2006-2010) at which participants were recruited and consent given
467,515 participants, 467,515 items
| Maximum | 60.1196 |
| Decile 9 | 18.124 |
| Decile 8 | 14.7183 |
| Decile 7 | 13.216 |
| Decile 6 | 12.29 |
| Median | 11.631 |
| Decile 4 | 11.1121 |
| Decile 3 | 10.6563 |
| Decile 2 | 10.176 |
| Decile 1 | 9.5167 |
| Minimum | 0.312706 |
|
|
- Mean = 13.0224
- Std.dev = 4.79543
- 13227 items above graph maximum of 26.7313
|
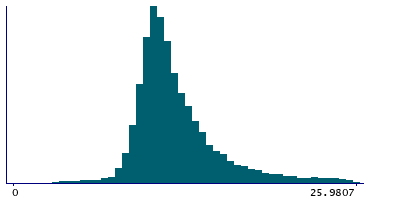
Instance 1 : First repeat assessment visit (2012-13)
19,105 participants, 19,105 items
| Maximum | 52.257 |
| Decile 9 | 17.8575 |
| Decile 8 | 14.69 |
| Decile 7 | 13.29 |
| Decile 6 | 12.3495 |
| Median | 11.684 |
| Decile 4 | 11.155 |
| Decile 3 | 10.666 |
| Decile 2 | 10.161 |
| Decile 1 | 9.4794 |
| Minimum | 1.7776 |
|
|
- Mean = 13.0129
- Std.dev = 4.75649
- 564 items above graph maximum of 26.2357
|


